. 2022 Dec 1;14(23):5951.
doi: 10.3390/cancers14235951.

ACAP1 Deficiency Predicts Inferior Immunotherapy Response in Solid Tumors

Affiliations

ACAP1 Deficiency Predicts Inferior Immunotherapy Response in Solid Tumors

Qiyi Yi et al. Cancers (Basel). .

Abstract

Background: ACAP1 plays a key role in endocytic recycling, which is essential for the normal function of lymphocytes. However, the expression and function of ACAP1 in lymphocytes have rarely been studied.

Methods: Large-scale genomic data, including multiple bulk RNA-sequencing datasets, single-cell sequencing datasets, and immunotherapy cohorts, were exploited to comprehensively characterize ACAP1 expression, regulation, and function. Gene set enrichment analysis (GSEA) was used to uncover the pathways associated with ACAP1 expression. Eight algorithms, including TIMER, CIBERSORT, CIBERSORT-ABS, QUANTISEQ, xCELL, MCPCOUNTER, EPIC, and TIDE, were applied to estimate the infiltrating level of immune cells. Western blotting, qPCR, and ChIP-PCR were used to validate the findings from bioinformatic analyses. A T-cell co-culture killing assay was used to investigate the function of ACAP1 in lymphocytes.

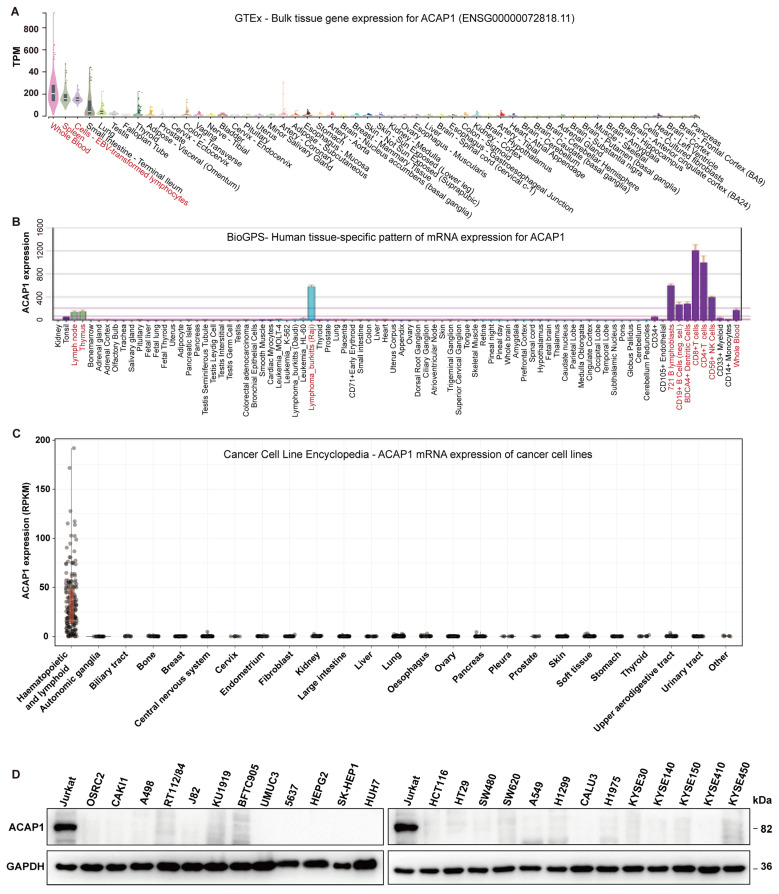
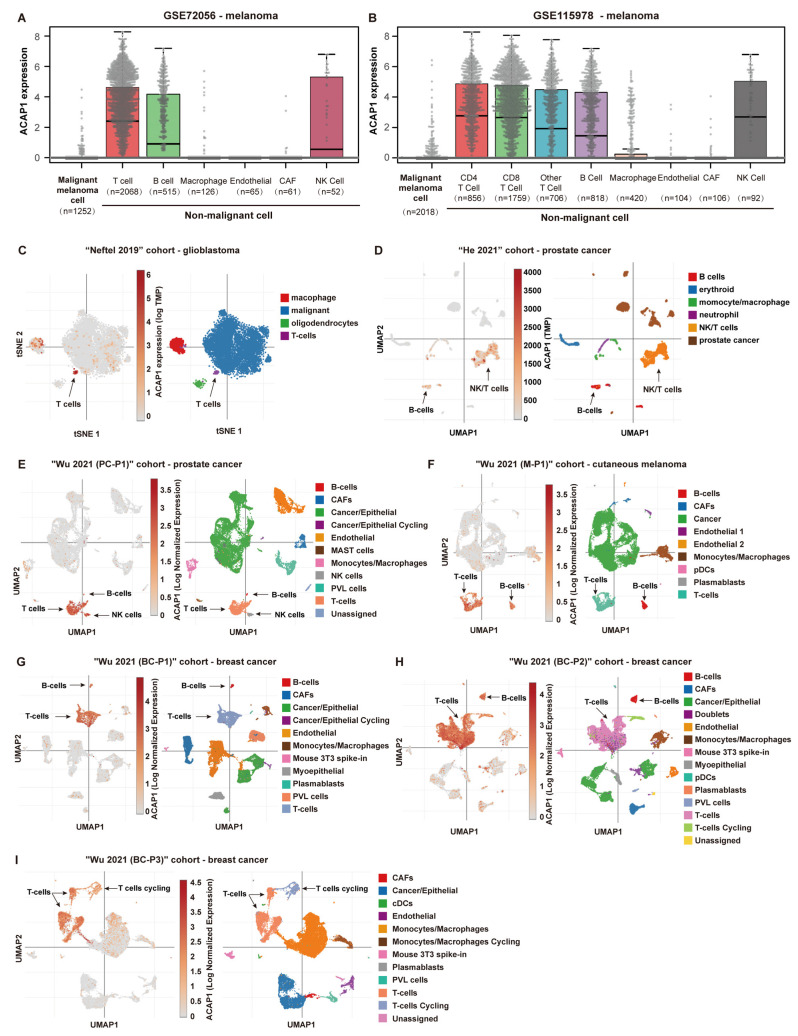
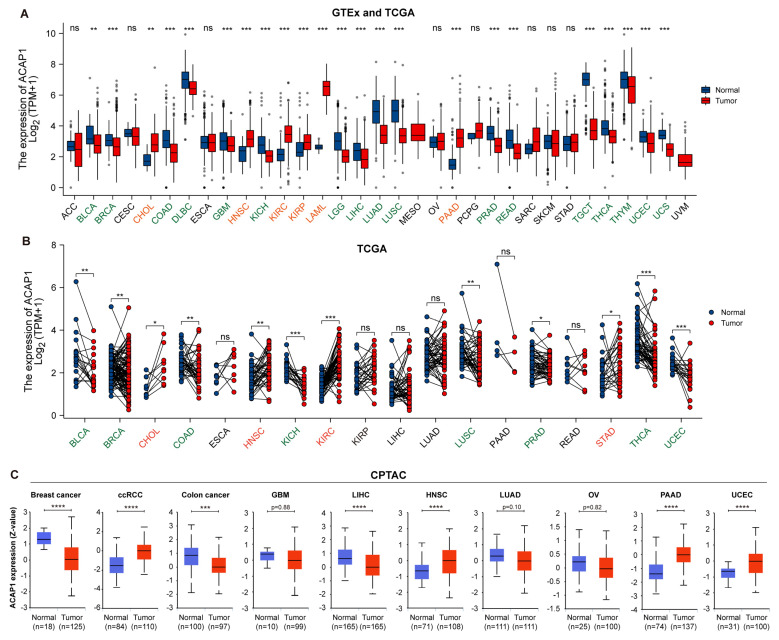
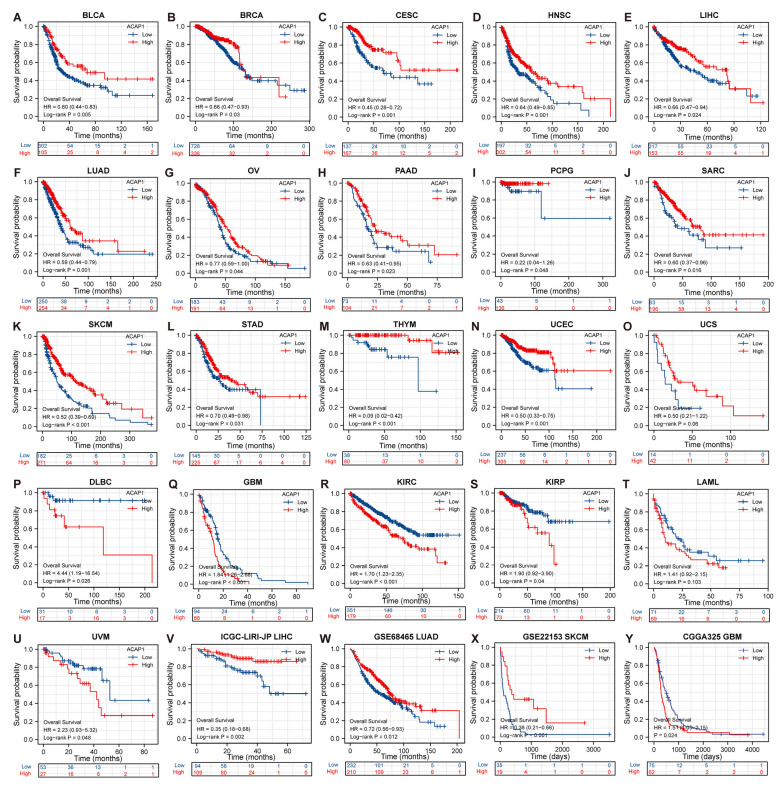
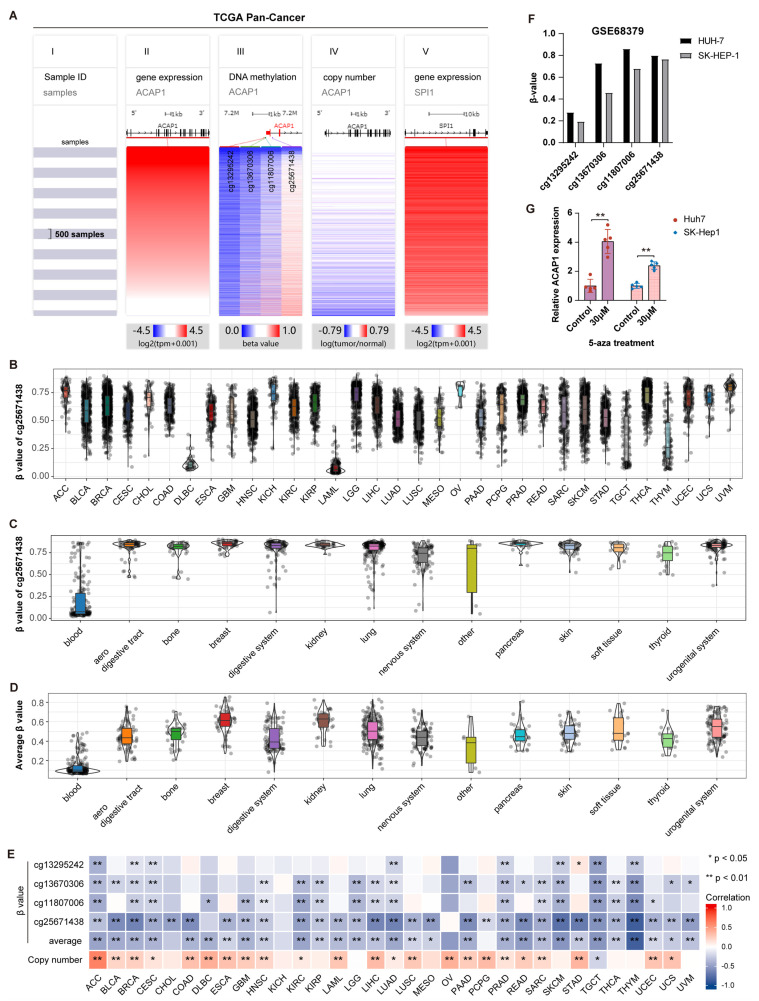
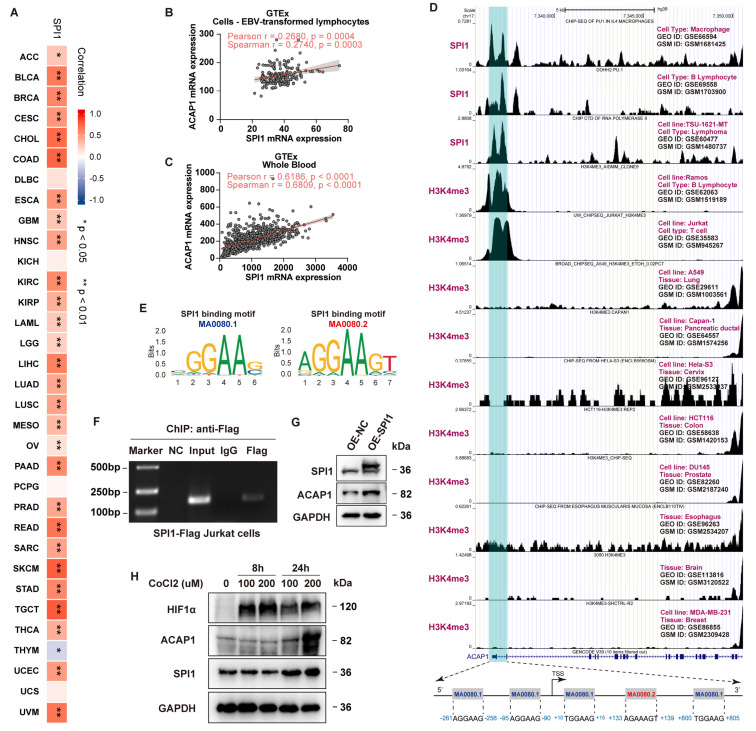
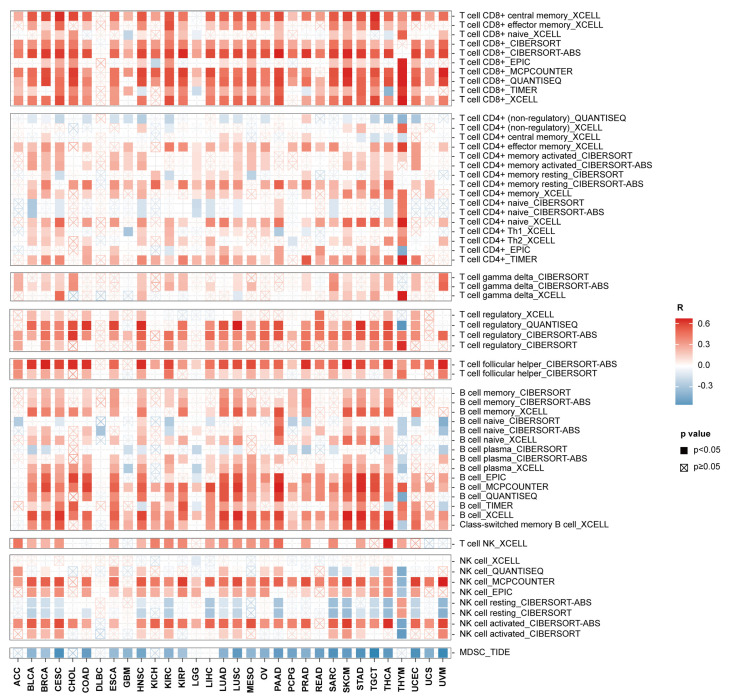
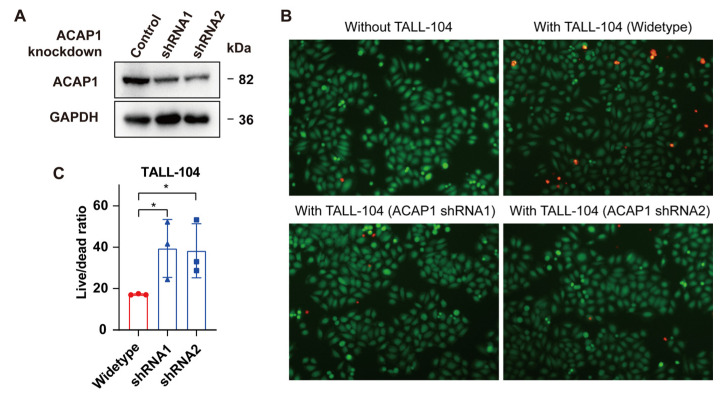
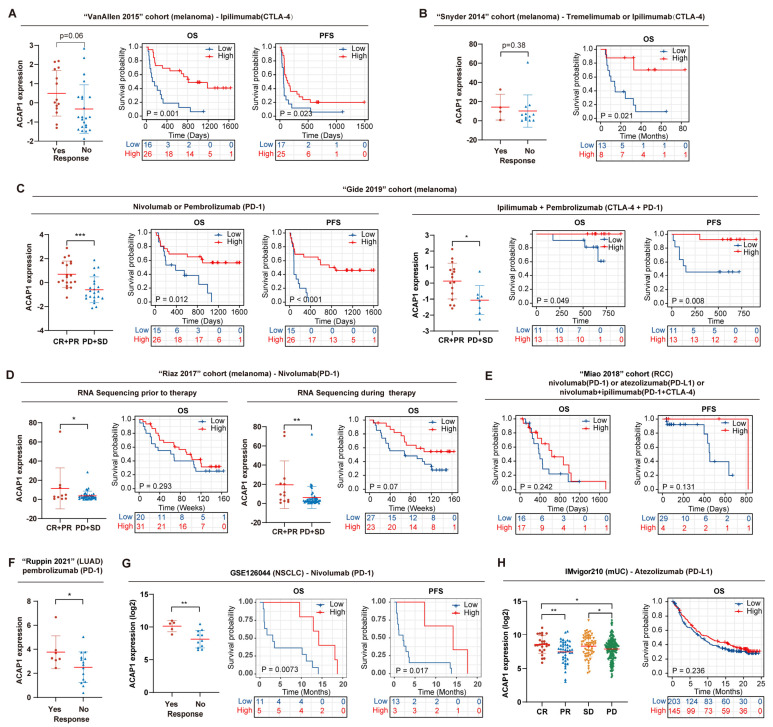
Results: ACAP1 was highly expressed in immune-related tissues and cells and minimally in other tissues. Moreover, single-cell sequencing analysis in tumor samples revealed that ACAP1 is expressed primarily in tumor-infiltrating lymphocytes (TILs), including T, B, and NK cells. ACAP1 expression is negatively regulated by promoter DNA methylation, with its promoter hypo-methylated in immune cells but hyper-methylated in other cells. Furthermore, SPI1 binds to the ACAP1 promoter and positively regulates its expression in immune cells. ACAP1 levels positively correlate with the infiltrating levels of TILs, especially CD8+ T cells, across a broad range of solid cancer types. ACAP1 deficiency is associated with poor prognosis and immunotherapeutic response in multiple cancer types treated with checkpoint blockade therapy (ICT). Functionally, the depletion of ACAP1 by RNA interference significantly impairs the T cell-mediated killing of tumor cells.

Conclusions: Our study demonstrates that ACAP1 is essential for the normal function of TILs, and its deficiency indicates an immunologically "cold" status of tumors that are resistant to ICT.

Keywords: ACAP1; CD8+ T cells; cancer immunotherapy; immune checkpoint blockade therapy (ICT); tumor-infiltrating lymphocytes (TILs).


Conflict of interest statement

Authors declare no conflict of interests.

Figures

Figure 1
Figure 1
ACAP1 mRNA expression across different tissues and cell lines. (A) Violin plots of ACAP1 expression levels across all available tissues ordered by ACAP1 expression in the GTEx Portal. (B) ACAP1 expression levels in human tissues and cell lines were visualized by BioGPS. Red: tissues and cells with relatively high ACAP1 expression. (C) Violin plots of ACAP1 expression levels across different types of cancer cell lines in the CCLE dataset. (D) The protein levels of ACAP1 from indicated cell lines were determined by Western blotting.
Figure 2
Figure 2
Single-cell gene expression analysis of ACAP1. (A,B) Single-cell RNA sequencing analyses of ACAP1 mRNA expression across various cell types in melanoma datasets GSE72096 and GSE115978. (C) Single-cell expression patterns of ACAP1 in the glioblastoma dataset “Neftel 2019” are shown with tSNE plots. (D,E) Single-cell expression patterns of ACAP1 in prostate cancer datasets, including “He 2021” and “Wu 2021 (PC-P1)”, are shown with UMAP plots. (F) Single-cell expression patterns of ACAP1 in the cutaneous melanoma dataset “Wu 2021 (M-P1)” are shown with UMAP plots. (GI) Single-cell expression patterns of ACAP1 in breast cancer datasets, including “Wu 2021 (BC-P1)”, “Wu 2021 (BC-P2)”, and “Wu 2021 (BC-P3)”, are shown with UMAP plots.
Figure 3
Figure 3
Pan-cancer analysis of ACAP1 expression in human cancer. (A) Comparing of ACAP1 mRNA levels in tumor vs. normal samples across TCGA cancer types by combing the TCGA and GTEx data. (B) Paired comparison of ACAP1 mRNA levels in tumor vs. normal samples in TCGA. Green: decreased ACAP1 expression in tumors; Red: elevated gene expression in tumors. (C) Comparison of ACAP1 protein levels in tumor vs. normal samples across all cancer types available in CPTAC using UALCAN webtool. **** p < 0.0001, *** p < 0.001, ** p < 0.01, * p < 0.05, ns (non-significant).
Figure 4
Figure 4
Implications of ACAP1 expression on overall survival of cancer patients across multiple cancer types. (AU) Overall survival analyses of cancer patients stratified by ACAP1 mRNA level with the Kaplan–Meier method in TCGA datasets. (VY) Overall survival analyses of cancer patients stratified by ACAP1 mRNA level in ICGC-LIRI-JP(LIHC), GSE68465(LUAD), GSE22153(SKCM), and CGGA325(GBM) datasets.
Figure 5
Figure 5
Transcriptional regulation of ACAP1. (A) Heatmap of TCGA samples (I), ACAP1 mRNA expression (II), β-value (methylation level) of 4 CpG sites, including cg13295242, cg13670306, cg11807006, and cg25671438, in the ACAP1 promoter region (III), copy number variation (IV), and SPI1 mRNA expression (V) in TCGA pan-cancer dataset. The samples were ordered by ACAP1 expression. Blue: low level; Red: high level. (B) Violin plots showing the β-value of cg25671438 in indicated cancers of TCGA. (C,D) Violin plots showing the β-value of cg25671438 and the average β-value of 4 CpG sites in indicated cancer cell lines of GSE68379. (E) Heatmap of the Spearman correlation coefficient of ACAP1 mRNA levels with β value of CpG sites in ACAP1 promoter and copy number across 33 cancer types in TCGA. (F) The β-value of 4 CpG sites in the ACAP1 promoter region of Huh-7 and SK-HEP-1 cells in GSE68379. (G) The impact of 5-aza on ACAP1 mRNA level in Huh-7 and SK-HEP-1 cells. ** p < 0.01, * p < 0.05.
Figure 6
Figure 6
Transcriptional regulation of ACAP1 by SPI1. (A) Heatmap of the correlation coefficient of ACAP1 mRNA levels and SPI1 levels across 33 cancer types in TCGA. (B) Scatter plot displays the SPI1 and ACAP1 mRNA expression in EBV-transformed lymphocytes of GTEx dataset. (C) Scatter plot displays the SPI1 and ACAP1 mRNA expression in whole blood of GTEx dataset. (D) ChIP-sequencing peaks of SPI1 in macrophage, B lymphocyte, and lymphoma; H3K4me3 in Ramos B-lymphocytes, Jurkat T-cell, A549 lung cancer cells, Capan-1 pancreatic ductal cancer cells, Hela-S3 cervix cancer cells, HCT116 colon cancer cells, DU145 prostate cancer cells, esophagus cells, brain cells, and MDA-MB-231 breast cancer cells. The binding region of SPI1 on ACAP1 promoter is highlighted in cyan shaded box. The SPI1 binding sites on ACAP1 promoter predicted by JASPAR are shown. (E) SPI1 binding motif MA0080.1 and MA0080.2 from JASPAR curated motif database. (F) ChIP-PCR showed SPI1 binds to the promoter of ACAP1 in Jurkat cells. (G) Analysis of SPI1 overexpression on ACAP1 protein expression in Jurkat by Western blotting. (H) Effects of hypoxia-mimicking CoCl2 treatment on HIF1α, SPI1, and ACAP1 expression in Jurkat cells were determined by Western blotting, ** p < 0.01, * p < 0.05.
Figure 7
Figure 7
The Spearman correlations of ACAP1 expression with immune cell infiltration across 32 cancer types in TCGA.
Figure 8
Figure 8
ACAP1 knockdown impairs the cytotoxicity of T cells against tumor cells. (A) Western blotting of lysates from TALL-104 cells infected with control or two different ACAP1-targeting shRNA lentiviruses. (B) Representative images of live/dead A549 cells co-cultured with different TALL-104 cells at a 1:2 cell ratio for 24 h were shown. Red-fluorescent PI (propidium iodide) was used to detect dead cells. Green-fluorescent CMFDA (5-chloromethylfluorescein diacetate) was used to detect live cells. Scale bars, 100 μm. (C) Three random fields were analyzed, and live/dead cell ratios were quantified. * p < 0.05.
Figure 9
Figure 9
ACAP1 deficiency correlates with inferior ICT response and prognosis in multiple cancer types. (A) ACAP1 expression in different response groups; Kaplan–Meier OS and PFS estimates according to ACAP1 expression in “VanAllen2015” cohort, of which melanoma patients were treated with anti-CTLA-4 antibody (ipilimumab). (B) ACAP1 expression in different response groups; Kaplan–Meier OS estimates according to ACAP1 expression in “Snyder 2014” cohort, in which melanoma patients were treated with anti-CTLA-4 antibody (tremelimumab or ipilimumab). (C) ACAP1 expression in different response groups; Kaplan–Meier OS and PFS estimates according to ACAP1 expression in the “Gide 2019” cohort, in which melanoma patients were treated with anti-PD1 antibody (nivolumab or pembrolizumab) or anti-CTLA-4/PD-1 antibody (ipilimumab + pembrolizumab) (one patient with the extreme value of ACAP1 expression was excluded). (D) ACAP1 expression in different response groups; Kaplan–Meier OS estimates according to ACAP1 expression in both “prior to therapy” and “during therapy” groups of “Riaz 2017” cohort, in which melanoma patients were treated with anti-PD1 antibody (nivolumab). (E) Kaplan–Meier OS and PFS estimate according to ACAP1 expression in the “Miao 2018” cohort, in which RCC patients were treated with anti-PD-1 and/or anti-CTLA-4 antibodies (nivolumab or atezolizumab or nivolumab + ipilimumab). (F) ACAP1 expression in different response groups in the “Ruppin 2021” cohort, of which LUAD (lung adenocarcinoma) patients were treated with anti-PD-1 antibody (pembrolizumab). (G) ACAP1 expression in different response groups; Kaplan–Meier OS and PFS estimates according to ACAP1 expression in GSE126044, in which NSCLC patients were treated with anti-PD-1 antibody (nivolumab). (H) ACAP1 expression in different response groups; Kaplan–Meier OS estimates according to ACAP1 expression in the “IMvigor210” cohort, in which mUC patients were treated with anti-PD-L1 antibody (atezolizumab). OS: overall survival. PFS: progression-free survival. Kaplan–Meier survival curves with p-values derived by log-rank test were shown. *** p < 0.001, ** p < 0.01, * p < 0.05.

Similar articles

Cited by

References

    1. Sharma P., Hu-Lieskovan S., Wargo J.A., Ribas A. Primary, Adaptive, and Acquired Resistance to Cancer Immunotherapy. Cell. 2017;168:707–723. doi: 10.1016/j.cell.2017.01.017. - DOI - PMC - PubMed
    1. Kennedy L.B., Salama A.K.S. A review of cancer immunotherapy toxicity. CA Cancer J. Clin. 2020;70:86–104. doi: 10.3322/caac.21596. - DOI - PubMed
    1. Paijens S.T., Vledder A., de Bruyn M., Nijman H.W. Tumor-infiltrating lymphocytes in the immunotherapy era. Cell Mol. Immunol. 2021;18:842–859. doi: 10.1038/s41423-020-00565-9. - DOI - PMC - PubMed
    1. Tumeh P.C., Harview C.L., Yearley J.H., Shintaku I.P., Taylor E.J., Robert L., Chmielowski B., Spasic M., Henry G., Ciobanu V., et al. PD-1 blockade induces responses by inhibiting adaptive immune resistance. Nature. 2014;515:568–571. doi: 10.1038/nature13954. - DOI - PMC - PubMed
    1. McDermott D.F., Huseni M.A., Atkins M.B., Motzer R.J., Rini B.I., Escudier B., Fong L., Joseph R.W., Pal S.K., Reeves J.A., et al. Clinical activity and molecular correlates of response to atezolizumab alone or in combination with bevacizumab versus sunitinib in renal cell carcinoma. Nat. Med. 2018;24:749–757. doi: 10.1038/s41591-018-0053-3. - DOI - PMC - PubMed