. 2022 Dec 4;14(23):5987.
doi: 10.3390/cancers14235987.

Impact of the Area of Residence of Ovarian Cancer Patients on Overall Survival

Affiliations

Impact of the Area of Residence of Ovarian Cancer Patients on Overall Survival

Floriane Jochum et al. Cancers (Basel). .

Abstract

Survival disparities persist in ovarian cancer and may be linked to the environments in which patients live. The main objective of this study was to analyze the global impact of the area of residence of ovarian cancer patients on overall survival. The data were obtained from the Surveillance, Epidemiology and End Results (SEER) database. We included all the patients with epithelial ovarian cancers diagnosed between 2010 and 2016. The areas of residence were analyzed by the hierarchical clustering of the principal components to group similar counties. A multivariable Cox proportional hazards model was then fitted to evaluate the independent effect of each predictor on overall survival. We included a total of 16,806 patients. The clustering algorithm assigned the 607 counties to four clusters, with cluster 1 being the most disadvantaged and cluster 4 having the highest socioeconomic status and best access to care. The area of residence cluster remained a statistically significant independent predictor of overall survival in the multivariable analysis. The patients living in cluster 1 had a risk of death more than 25% higher than that of the patients living in cluster 4. This study highlights the importance of considering the sociodemographic factors within the patient's area of residence when developing a care plan and follow-up.

Keywords: area of residence; hierarchical cluster algorithm; ovarian cancer; sociodemographic factor.


Conflict of interest statement

The authors declare no conflict of interest.

Figures
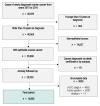
Figure 1
Figure 1
Flowchart.
Figure 2
Figure 2
Combinations of metastases in patients with AJCC stage IV tumors at diagnosis: (a) description of the different combinations of metastases; (b) distribution of associations of metastases by histological subtype (p < 0.001).
Figure 3
Figure 3
Clustering results: (a) cluster dendrogram; (b) distribution of county clusters according to the first two dimensions.
Figure 4
Figure 4
Characteristics of the clusters: (a) distribution of the variables related to education; (b) distribution of the variables related to income and poverty; (c) distribution of the variable related to employment; (d) distribution of the variables related to immigration; (e) disparity in access to care between the four clusters. Access to care is most difficult in cluster 1 and easiest in cluster 4. FOBT = Fecal Occult Blood Test. CRC = Colorectal Cancer Screening Blood Test. (f) Rural/urban distribution of the population in each cluster.
Figure 4
Figure 4
Characteristics of the clusters: (a) distribution of the variables related to education; (b) distribution of the variables related to income and poverty; (c) distribution of the variable related to employment; (d) distribution of the variables related to immigration; (e) disparity in access to care between the four clusters. Access to care is most difficult in cluster 1 and easiest in cluster 4. FOBT = Fecal Occult Blood Test. CRC = Colorectal Cancer Screening Blood Test. (f) Rural/urban distribution of the population in each cluster.
Figure 5
Figure 5
Map of the county clusters in the United States. Of the 3143 counties in the United States, 609 are represented in the ovarian cancer SEER. We excluded two counties located in Alaska due to a lack of data.
Figure 6
Figure 6
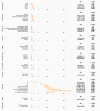
Univariable survival analysis for county clusters stratified for cancer stage: (a) early stages; (b) advanced stages.
Figure 7
Figure 7
Multivariable survival analysis.

References

    1. Siegel R.L., Miller K.D., Fuchs H.E., Jemal A. Cancer statistics, 2022. CA Cancer J. Clin. 2022;72:7–33. doi: 10.3322/caac.21708. - DOI - PubMed
    1. Bristow R.E., Powell M.A., Al-Hammadi N., Chen L., Miller J.P., Roland P.Y., Mutch D.G., Cliby W.A. Disparities in Ovarian Cancer Care Quality and Survival According to Race and Socioeconomic Status. J. Natl. Cancer Inst. 2013;105:823–832. doi: 10.1093/jnci/djt065. - DOI - PMC - PubMed
    1. Ellis L., Canchola A.J., Spiegel D., Ladabaum U., Haile R., Gomez S.L. Racial and Ethnic Disparities in Cancer Survival: The Contribution of Tumor, Sociodemographic, Institutional, and Neighborhood Characteristics. J. Clin. Oncol. 2018;36:25–33. doi: 10.1200/JCO.2017.74.2049. - DOI - PMC - PubMed
    1. Gomez S.L., Shariff-Marco S., DeRouen M., Keegan T.H.M., Yen I.H., Mujahid M., Satariano W.A., Glaser S.L. The Impact of Neighborhood Social and Built Environment Factors across the Cancer Continuum: Current Research, Methodological Considerations, and Future Directions. Cancer. 2015;121:2314–2330. doi: 10.1002/cncr.29345. - DOI - PMC - PubMed
    1. Russell E.F., Kramer M.R., Cooper H.L.F., Gabram-Mendola S., Senior-Crosby D., Jacob Arriola K.R. Metropolitan Area Racial Residential Segregation, Neighborhood Racial Composition, and Breast Cancer Mortality. Cancer Causes Control. 2012;23:1519–1527. doi: 10.1007/s10552-012-0029-4. - DOI - PubMed

LinkOut - more resources