. 2022 Dec 6;14(23):6006.
doi: 10.3390/cancers14236006.

PKCβ Facilitates Leukemogenesis in Chronic Lymphocytic Leukaemia by Promoting Constitutive BCR-Mediated Signalling

Affiliations

PKCβ Facilitates Leukemogenesis in Chronic Lymphocytic Leukaemia by Promoting Constitutive BCR-Mediated Signalling

Jodie Hay et al. Cancers (Basel). .

Abstract

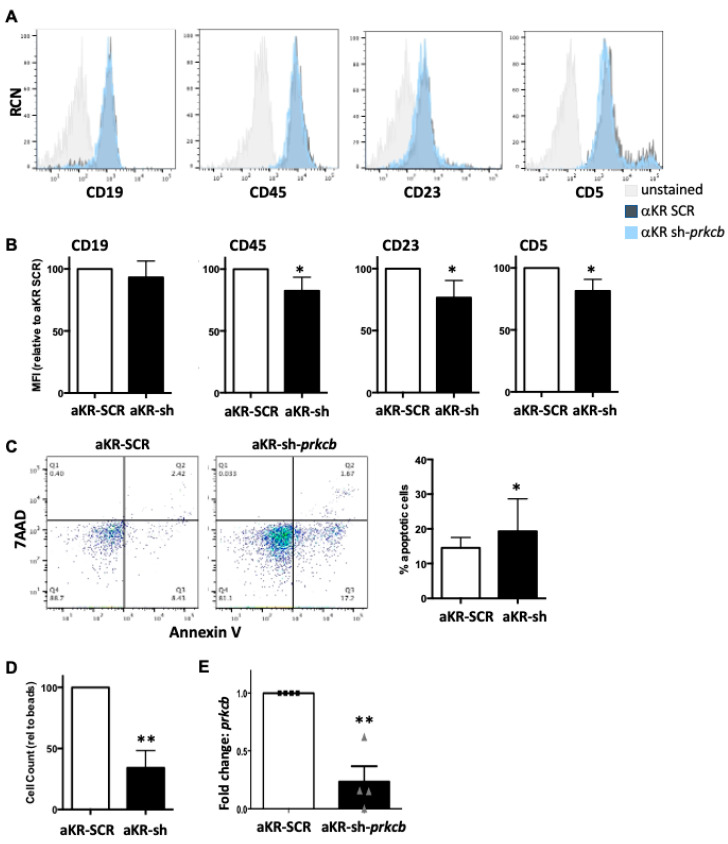
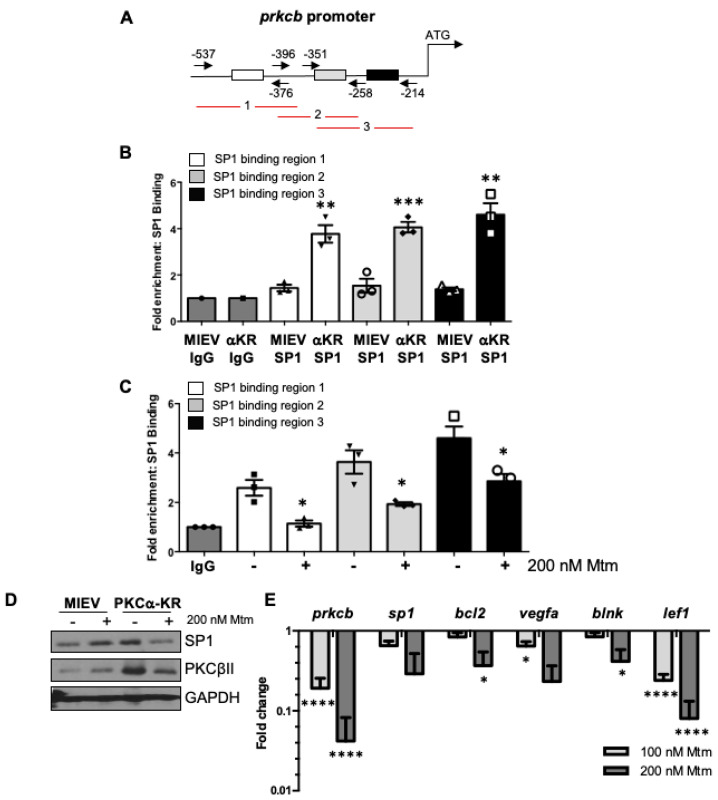
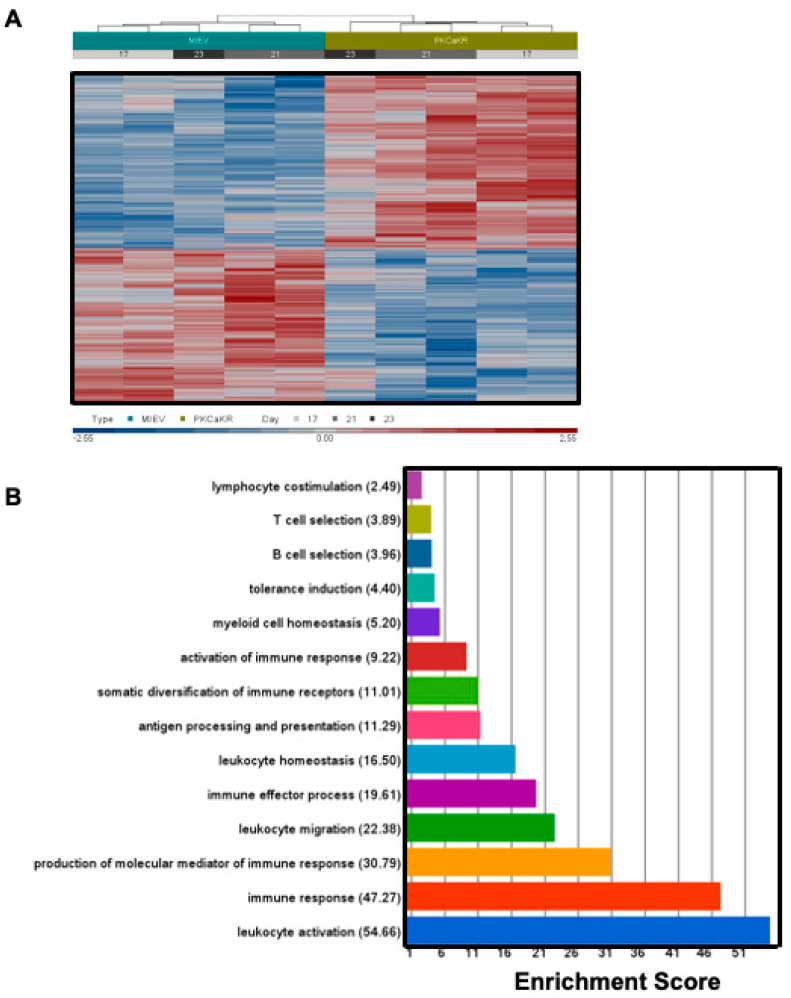
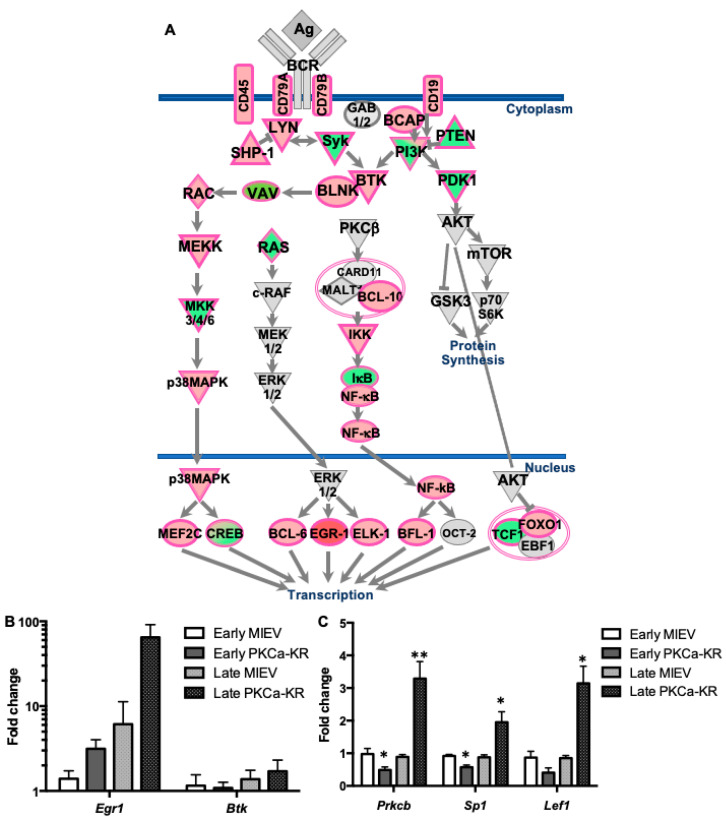
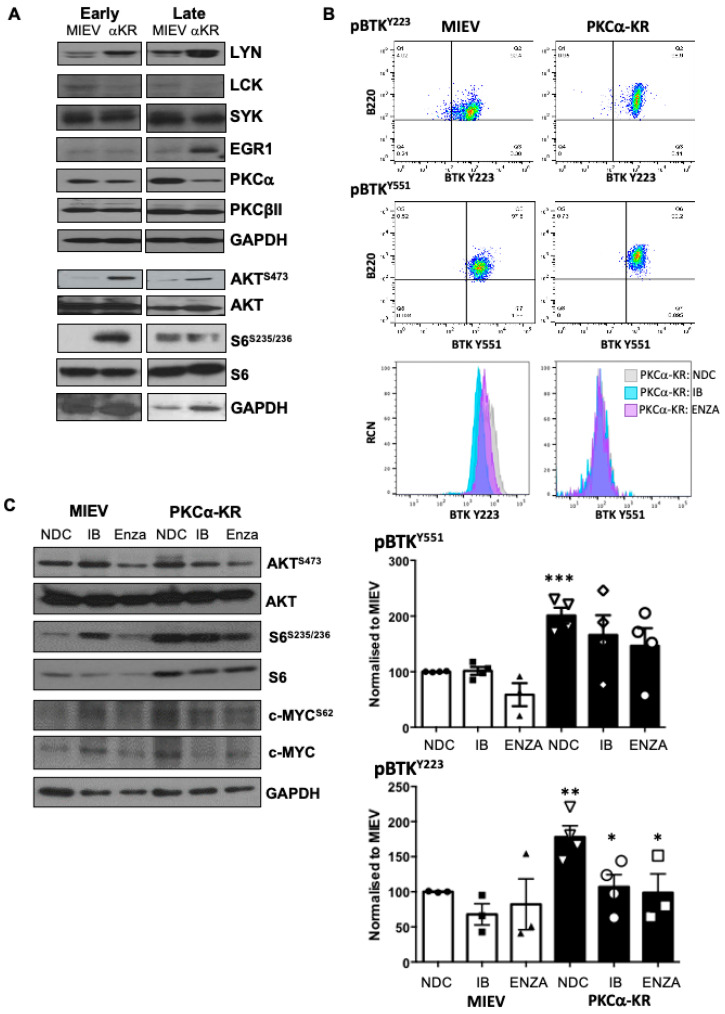
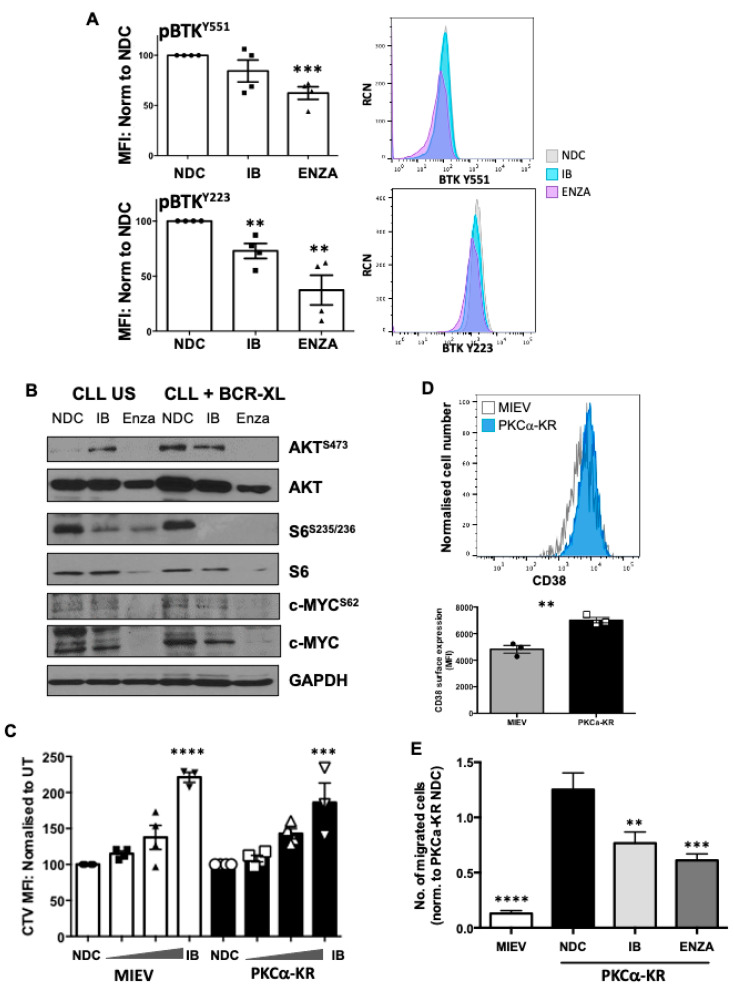
B cell antigen receptor (BCR) signalling competence is critical for the pathogenesis of chronic lymphocytic leukaemia (CLL). Defining key proteins that facilitate these networks aid in the identification of targets for therapeutic exploitation. We previously demonstrated that reduced PKCα function in mouse hematopoietic stem/progenitor cells (HPSCs) resulted in PKCβII upregulation and generation of a poor-prognostic CLL-like disease. Here, prkcb knockdown in HSPCs leads to reduced survival of PKCα-KR-expressing CLL-like cells, concurrent with reduced expression of the leukemic markers CD5 and CD23. SP1 promotes elevated expression of prkcb in PKCα-KR expressing cells enabling leukemogenesis. Global gene analysis revealed an upregulation of genes associated with B cell activation in PKCα-KR expressing cells, coincident with upregulation of PKCβII: supported by activation of key signalling hubs proximal to the BCR and elevated proliferation. Ibrutinib (BTK inhibitor) or enzastaurin (PKCβII inhibitor) treatment of PKCα-KR expressing cells and primary CLL cells showed similar patterns of Akt/mTOR pathway inhibition, supporting the role for PKCβII in maintaining proliferative signals in our CLL mouse model. Ibrutinib or enzastaurin treatment also reduced PKCα-KR-CLL cell migration towards CXCL12. Overall, we demonstrate that PKCβ expression facilitates leukemogenesis and identify that BCR-mediated signalling is a key driver of CLL development in the PKCα-KR model.

Keywords: BCR signalling; CLL; PKCβ; SP1; leukemogenesis.


Conflict of interest statement

The authors declare no conflict of interest.

Figures

Figure 1
Figure 1
Reduction in PKCβ expression inhibits the initiation of PKCα-KR-mediated CLL development. Knockdown of prkcb (or scrambled (SCR) control) was performed in HSPC cells within 24 h of isolation from the mouse, then these cells were retrovirally transduced with MIEV or PKCα-KR (αKR) at d7. Cells were co-cultured with OP9 in the presence of cytokines for up to 35 days. Phenotypic characterisation of the cells was carried out by flow cytometry analysing: (A) CD19, CD45, CD23 and CD5. Representative histogram plots are shown, gated on FSC/SSC and GFP+ cells comparing αKR sh-prkcb cells with αKR-SCR cells compared with unstained cells (gating strategy shown in Supplementary Figure S1); (B) Average MFIs of CD19, CD45, CD23 and CD5 surface markers are shown relative to αKR-SCR cultures (n = 5); (C) Apoptosis was determined by AnnV/7AAD staining. A representative dot plot shows Annexin V vs. 7AAD staining in αKR-SCR cells and αKR sh-prkcb. The graph shows the percentage apoptotic (AnnV+) cells present in cultures post d14 (n = 5); (D) Cell counts were performed with flow cytometry using counting beads, shown relative to a set bead number acquired (n = 5); (E) qPCR analysis of prkcb expression, αKR-SCR (circles) compared with αKR sh-prkcb (triangles). Gapdh was used as the reference gene and αKR-SCR-transduced cells were used as a calibrator (n = 4). All experiments shown are representative of n ≥ 4 biological replicates as indicated. Paired student t-test with Wilcoxon matched-pair signed rank test was used to analyse the data. * p < 0.05, ** p < 0.01.
Figure 2
Figure 2
Sp1 binding is upregulated in the prkcb promoter of PKCα-KR transduced CLL-like cells. (A) Diagram showing Sp1 binding sites at the prkcb promoter, the primer locations and the three products; (B) ChIP analysis was performed in MIEV (binding region 1 (black triangles), 2 (white circles), 3 (white triangles)) and PKCα-KR cells (binding region 1 (inverted triangles), 2 (diamonds), 3 (squares)) at the late stage of co-culture (> d17) to determine Sp1 binding occupancy at the prkcb promoter (average of n = 3 biological replicates); (C) ChIP analysis was performed in PKCα-KR cells in the absence (binding region 1 (black squares), 2 (inverted triangles), 3 (white squares)) and presence of 200 nM mithramycin (mtm; binding region 1 (triangles), 2 (diamonds), 3 (circles)) for 12 h to determine Sp1 binding at the prkcb promoter (average of n = 3 biological replicates); (D) The expression levels of Sp1 and PKCβII were determined by Western blotting in MIEV and PKCα-KR cells treated with 200 nM mtm (representative blot shown of n = 3 experiments; densitometry of the blots and the full blots shown in Supplementary Figure S2). (E) qPCR analysis of prkcb, sp1, bcl2, vegfa, blnk, lef1 genes in PKCα-KR cells upon treatment with mtm (average of n = 2/3 biological replicates, an average of technical duplicates). Gapdh was used as the reference gene and normalised to NDC. Unpaired student t-tests (B,C) or one-way ANOVA (E) were used to analyse the data (where biological triplicates were performed). * p < 0.05, ** p < 0.01, *** p < 0.001, **** p < 0.0001.
Figure 3
Figure 3
Gene expression comparisons between PKCα-KR vs. MIEV B lineage cells. (A) Hierarchical clustering of the relative gene expression using the Euclidian matric with average linkage (Partek Genomics Suite, v6.6) for PKCα-KR vs. MIEV raw Affymetrix files (n = 5). Culture day for each column identified in grey for both PKCα-KR and MIEV cells (day 17, 21 or 23). (B) Gene ontology enrichment analysis of the significantly altered genes (fold change ± 1.2 and p-value < 0.05) between late co-culture PKCα-KR vs. MIEV cells, identified immune system processes as the most enriched groups of pathways. Functional groups with the highest over-representation of genes within the gene list compared to background are shown alongside their respective enrichment score (−log p-value of a chi-square test).
Figure 4
Figure 4
Global gene expression analysis revealed activation of the BCR-mediated signalling pathway in PKCα-KR cells. Global RNA analysis was performed using Affymetrix GeneChip mouse gene 1.0 ST on MIEV and PKCα-KR transduced cells at d17–23 in the B cell transformation co-culture. (A) Dysregulated components of the BCR pathway in PKCα-KR vs. MIEV cells isolated from late co-cultures (n = 5 PKCα-KR, n = 5 MIEV) were identified. Significantly up- and down-regulated components are highlighted in pink/red and green, respectively; (B) qPCR validation of egr1 and btk genes, which were both upregulated in the microarray analysis at the late stage (d15–23) of B cell transformation, compared with the early stage (d6–10). Data are an average of n = 2–4 biological replicates, normalised to tbp. (C) Comparison of prkcb, sp1 and lef1 gene expression in the early vs. late stages of B cell transformation co-cultures, determined by qPCR. Data represent n = 3–5 biological replicates, normalised to gapdh. Unpaired student t-tests were used to analyse the data. * p < 0.05, ** p < 0.01.
Figure 5
Figure 5
Inhibition of PKCβ activity downregulates key proteins in the BCR signalosome in mouse CLL model. (A) The expression/activation status of key hubs proximal and distal to the BCR pathway was analysed by Western blotting in early and late co-cultures of MIEV and PKCα-KR cells. Representative Western blots are shown. Densitometry of Western blots for these proteins (n ≥ 4) is shown in Supplementary Figure S4. (B) Phospho-flow was used to analyse the levels of BTKY551 and BTKY223 phosphorylation in MIEV (left) and PKCα-KR (right) cells in the presence and absence of either Ibrutinib (IB; 1 μM) or enzastaurin (Enza; 20 μM). Upper panel shows the flow cytometry dot plots of the mouse B lineage cells (B220+) vs. phospho-BTK, gated on FSC/SSC, while lower histogram plots show the effect of drug treatments on BTKY551 and BTKY223 phosphorylation as overlay (NDC—pale grey; IB—turquoise; ENZA—pink). Lower graphs show the average MFI of phospho-BTK normalised to MIEV no drug control (NDC; n = 3/4 independent experiments; MIEV—white bars (NDC (circles), IB (squares), ENZA (triangles), PKCα-KR—black bars (NDC (inverted triangles), IB (circles), ENZA (squares)). (C) MIEV and PKCα-KR cells were treated with either IB or Enza, or NDC. Representative Western blots are shown identifying the effect on key proteins within the BCR signalosome as indicated. Densitometry of the Western blots for these proteins (n = 3) is shown in Supplementary Figure S3. One-way ANOVA was used to analyse the data. * p < 0.05, ** p < 0.01, *** p < 0.001.
Figure 6
Figure 6
Inhibition of PKCβ upon treatment with enzastaurin downregulates key proteins within the BCR signalosome in primary CLL cells. (A,B) Human CLL cells were treated with 1 μM IB or 10 μM Enza in the presence or absence of BCR crosslinking (BCR-XL; F(ab’)2 fragment stimulation). A. Phospho-flow was used to analyse the levels of BTKY551 and BTKY223 phosphorylation upon treatment with drugs ± BCR-XL. Left-Graphs show the average MFI of the individual phospho-BTK sites as indicated, normalised to MIEV NDC (n = 4 individual patient samples; NDC (circles), IB (squares), ENZA (triangles)). Right-Histogram plots show the effect of drug treatments on BTKY551 and BTKY223 phosphorylation as overlay (NDC—pale grey; IB—turquoise; ENZA—pink); (B) Western blots were performed to identify the effect of drug treatment on key proteins within the BCR signalosome in human CLL cells. Representative Western blots are shown. Densitometry of the Western blots for these proteins (n ≥ 3 individual patients) is shown in Supplementary Figure S6; (C) Late co-culture MIEV and PKCα-KR cells (2 × 10⁶) were labelled with CTV and cultured for 48 h in the presence (100 nM—3 μM) of increasing concentrations of IB (squares, triangles, inverted triangles) or NDC (circles). Results are expressed as the CTV MFI relative to NDC cells for MIEV and PKCα-KR cultures (n = 4 individual experiments); (D) A histogram is shown comparing the surface expression of CD38 in MIEV and PKCα-KR cells taken from d33 of co-culture (upper) and the average MFI of CD38 expression is shown relative to MIEV cultures (n = 3); (E) Migration assessment of MIEV and PKCα-KR cells was performed in the presence and absence of 1 μM IB or 20 μM Enza. The data shown represent an average of 5 independent experiments. Unpaired student t-tests (D) or one-way ANOVA (A,C,E) were used to analyse the data. ** p < 0.01, *** p < 0.001, **** p < 0.0001.

References

    1. Stevenson F.K., Forconi F., Packham G. The meaning and relevance of B-cell receptor structure and function in chronic lymphocytic leukemia. Semin. Hematol. 2014;51:158–167. doi: 10.1053/j.seminhematol.2014.05.003. - DOI - PubMed
    1. Hamblin T.J., Davis Z., Gardiner A., Oscier D.G., Stevenson F.K. Unmutated Ig V(H) genes are associated with a more aggressive form of chronic lymphocytic leukemia. Blood. 1999;94:1848–1854. doi: 10.1182/blood.V94.6.1848. - DOI - PubMed
    1. Burger J.A., Chiorazzi N. B cell receptor signaling in chronic lymphocytic leukemia. Trends Immunol. 2013;34:592–601. doi: 10.1016/j.it.2013.07.002. - DOI - PMC - PubMed
    1. Slupsky J.R. Does B cell receptor signaling in chronic lymphocytic leukemia cells differ from that in other B cell types. Scientifica. 2014;2014:208928. doi: 10.1155/2014/208928. - DOI - PMC - PubMed
    1. Park H., Wahl M.I., Afar D.E., Turck C.W., Rawlings D.J., Tam C., Scharenberg A.M., Kinet J.P., Witte O.N. Regulation of Btk function by a major autophosphorylation site within the SH3 domain. Immunity. 1996;4:515–525. doi: 10.1016/S1074-7613(00)80417-3. - DOI - PubMed