

Global Transcriptional Profiling of Granulosa Cells from Polycystic Ovary Syndrome Patients: Comparative Analyses of Patients with or without History of Ovarian Hyperstimulation Syndrome Reveals Distinct Biomarkers and Pathways
- PMID: 36498516
- PMCID: PMC9740016
- DOI: 10.3390/jcm11236941
Global Transcriptional Profiling of Granulosa Cells from Polycystic Ovary Syndrome Patients: Comparative Analyses of Patients with or without History of Ovarian Hyperstimulation Syndrome Reveals Distinct Biomarkers and Pathways
Abstract
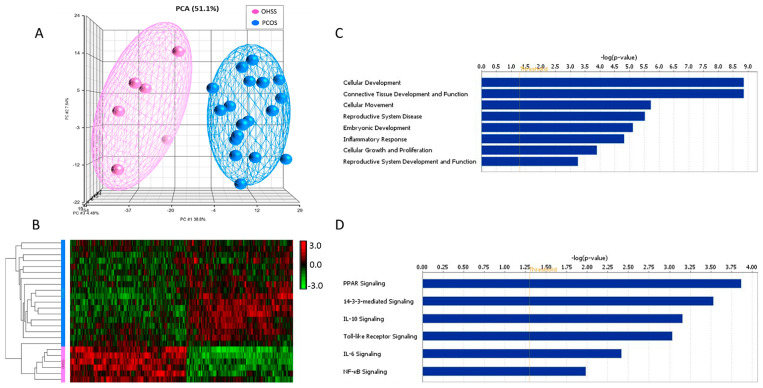
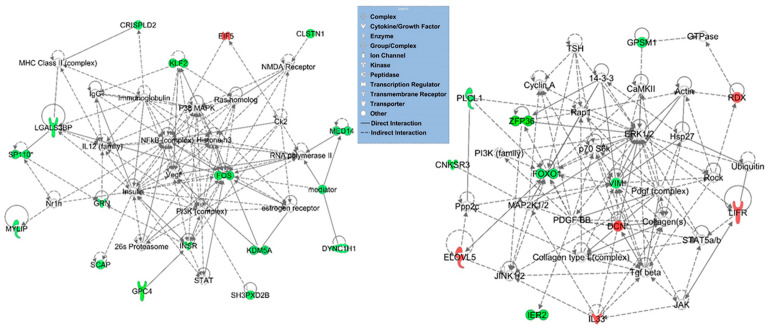
Ovarian hyperstimulation syndrome (OHSS) is often a complication of polycystic ovarian syndrome (PCOS), the most frequent disorder of the endocrine system, which affects women in their reproductive years. The etiology of OHSS is multifactorial, though the factors involved are not apparent. In an attempt to unveil the molecular basis of OHSS, we conducted transcriptome analysis of total RNA extracted from granulosa cells from PCOS patients with a history of OHSS (n = 6) and compared them to those with no history of OHSS (n = 18). We identified 59 significantly dysregulated genes (48 down-regulated, 11 up-regulated) in the PCOS with OHSS group compared to the PCOS without OHSS group (p-value < 0.01, fold change >1.5). Functional, pathway and network analyses revealed genes involved in cellular development, inflammatory and immune response, cellular growth and proliferation (including DCN, VIM, LIFR, GRN, IL33, INSR, KLF2, FOXO1, VEGF, RDX, PLCL1, PAPPA, and ZFP36), and significant alterations in the PPAR, IL6, IL10, JAK/STAT and NF-κB signaling pathways. Array findings were validated using quantitative RT-PCR. To the best of our knowledge, this is the largest cohort of Saudi PCOS cases (with or without OHSS) to date that was analyzed using a transcriptomic approach. Our data demonstrate alterations in various gene networks and pathways that may be involved in the pathophysiology of OHSS. Further studies are warranted to confirm the findings.
Keywords: biomarker; functional pathway; gene ontology; genome-wide gene expression; network analyses; ovarian hyperstimulation syndrome (OHSS); polycystic ovarian syndrome (PCOS); transcriptome.
Conflict of interest statement
The authors declare no conflict of interest. The funders had no role in the design of the study; in the collection, analyses, or interpretation of data; in the writing of the manuscript; or in the decision to publish the results.
Figures
Similar articles
-
Factors Associated with Ovarian Hyperstimulation Syndrome (OHSS) Severity in Women With Polycystic Ovary Syndrome Undergoing IVF/ICSI.Front Endocrinol (Lausanne). 2021 Jan 19;11:615957. doi: 10.3389/fendo.2020.615957. eCollection 2020. Front Endocrinol (Lausanne). 2021. PMID: 33542709 Free PMC article.
-
Transcriptomic landscape of granulosa cells and peripheral blood mononuclear cells in women with PCOS compared to young poor responders and women with normal response.Hum Reprod. 2022 May 30;37(6):1274-1286. doi: 10.1093/humrep/deac069. Hum Reprod. 2022. PMID: 35451009 Free PMC article.
-
Intrafollicular fluid metabolic abnormalities in relation to ovarian hyperstimulation syndrome: Follicular fluid metabolomics via gas chromatography-mass spectrometry.Clin Chim Acta. 2023 Jan 1;538:189-202. doi: 10.1016/j.cca.2022.11.033. Epub 2022 Dec 22. Clin Chim Acta. 2023. PMID: 36566958
-
The role of vascular endothelial growth factor and interleukins in the pathogenesis of severe ovarian hyperstimulation syndrome.Hum Reprod Update. 1997 May-Jun;3(3):255-66. doi: 10.1093/humupd/3.3.255. Hum Reprod Update. 1997. PMID: 9322101 Review.
-
Ultrasound-guided transvaginal ovarian needle drilling for clomiphene-resistant polycystic ovarian syndrome in subfertile women.Cochrane Database Syst Rev. 2019 Jul 31;7(7):CD008583. doi: 10.1002/14651858.CD008583.pub2. Cochrane Database Syst Rev. 2019. Update in: Cochrane Database Syst Rev. 2021 Nov 4;11:CD008583. doi: 10.1002/14651858.CD008583.pub3. PMID: 31425630 Free PMC article. Updated. Review.
Cited by
-
Identification of crucial pathways and genes linked to endoplasmic reticulum stress in PCOS through combined bioinformatic analysis.Front Mol Biosci. 2025 Jan 9;11:1504015. doi: 10.3389/fmolb.2024.1504015. eCollection 2024. Front Mol Biosci. 2025. PMID: 39850756 Free PMC article.
-
The Mediating Role of Plasma Inflammatory Proteins in Gut Microbiota-Driven Valvular Heart Disease: A Mendelian Randomization Study.Cell Biochem Biophys. 2025 May 28. doi: 10.1007/s12013-025-01780-9. Online ahead of print. Cell Biochem Biophys. 2025. PMID: 40425948
-
Identification of mitophagy-related biomarkers and immune infiltration in polycystic ovarian syndrome by bioinformatic study.Heliyon. 2025 Jan 23;11(3):e42202. doi: 10.1016/j.heliyon.2025.e42202. eCollection 2025 Feb 15. Heliyon. 2025. PMID: 39916834 Free PMC article.
-
Melatonin Ameliorates Ovarian Hyperstimulation Syndrome (OHSS) through SESN2 Regulated Antiapoptosis.Obstet Gynecol Int. 2023 Oct 28;2023:1121227. doi: 10.1155/2023/1121227. eCollection 2023. Obstet Gynecol Int. 2023. PMID: 37937274 Free PMC article.
-
Polycystic Ovary Syndrome and Ferroptosis: Following Ariadne's Thread.Biomedicines. 2024 Oct 8;12(10):2280. doi: 10.3390/biomedicines12102280. Biomedicines. 2024. PMID: 39457593 Free PMC article.
References
-
- Namavar Jahromi B.M., Parsanezhad M.M., Shomali Z.M., Bakhshai P.M., Alborzi M.M., Moin Vaziri N.M.D.P., Anvar Z.P. Ovarian Hyperstimulation Syndrome: A Narrative Review of Its Pathophysiology, Risk Factors, Prevention, Classification, and Management. Iran. J. Med. Sci. 2018;43:248–260. - PMC - PubMed
-
- Soave I., Marci R. Ovarian stimulation in patients in risk of OHSS. Minerva Ginecol. 2014;66:165–178. - PubMed
Grants and funding
LinkOut - more resources
Full Text Sources
Research Materials
Miscellaneous
