. 2022 Nov 28;11(23):7020.
doi: 10.3390/jcm11237020.

Genetic and Small-Molecule Modulation of Stat3 in a Mouse Model of Crohn's Disease

Affiliations

Genetic and Small-Molecule Modulation of Stat3 in a Mouse Model of Crohn's Disease

Prema Robinson et al. J Clin Med. .

Abstract

Crohn's disease (CD), is an inflammatory bowel disease that can affect any part of the gastro-intestinal tract (GI) and is associated with an increased risk of gastro-intestinal cancer. In the current study, we determined the role of genetic and small-molecule modulation of STAT3 in a mouse model of CD. STAT3 has 2 isoforms (α, β) which are expressed in most cells in a 4:1 ratio (α: β). STAT3α has pro-inflammatory and anti-apoptotic functions, while STAT3β has contrasting roles. We used an animal model of CD consisting of intrarectal administration of 2,4,6-trinitrobenzene sulfonic acid and examined the severity of CD in transgenic-mice that express only STAT3α (∆β/∆β), as well as in wild-type (WT) mice administered TTI-101 (formerly C188-9), a small molecule STAT3 inhibitor. We determined that clinical manifestations of CD, such as mortality, rectal-bleeding, colonic bleeding, diarrhea, and colon shortening, were exacerbated in ∆β/∆β transgenic versus cage-control WT mice, while they were markedly decreased by TTI-101 treatment of WT mice. TTI-101 treatment also increased apoptosis of pathogenic CD4+ T cells and reduced colon levels of IL-17-positive cells. Our results indicate that STAT3 contributes to CD and that targeting of STAT3 with TTI-101 may be a useful approach to treating CD.

Keywords: Crohn’s disease; STAT3; inflammatory bowel disease.


Conflict of interest statement

D.T. has the following conflict of interest: Baylor College of Medicine, with D.T. as primary inventor, filed patents concerning TTI-101. Tvardi Therapeutics, Inc. (TTI) currently holds an exclusive license to these patents. D.T. owns TTI stock and serves on the TTI Scientific Advisory Board. He has been in compliance with all conflict of interests (COI) policies at Baylor College of Medicine and currently is in compliance with all COI policies at the University of Texas M.D. Anderson Cancer Center, where he relocated in December 2014. The University of Texas MD Anderson Cancer Center has an institutional financial conflict of interest with Tvardi Therapeutics, Inc. related to the research being reported in this manuscript. David Tweardy, Division Head of Internal Medicine, also has a financial interest with Tvardi Therapeutics. Because MD Anderson is committed to the protection of human subjects and the effective management of its financial conflicts of interest in relation to its research activities, MD Anderson has implemented an Institutional Conflict of Interest Management and Monitoring Plan (Plan) to manage and monitor the conflict of interest with respect to MD Anderson’s conduct of this research. The remaining authors have no conflict to disclose.

Figures

Figure 1
Figure 1
Effects of TNBS-induced CD on mortality, diarrhea, colonic bleeding, and colon shortening in +/+ versusβ/∆β mice. Effect of STAT3 deletion on TNBS-induced CD was studied in +/+ and ∆β/∆β mice. (A) Survival was assessed daily and was 74% in the TNBS ∆β/∆β mice group vs. 100% in the TNBS +/+ mice group 48 hrs. post-administration of TNBS (p < 0.05, Kaplan–Meier analysis, n = 9–19). (B) Diarrheal score, (C,D) colonic bleeding, (E,F), and colon length were assessed 48 hrs. post-administration of TNBS. Results are expressed as the mean ± SEM of two separate experiments [*, vehicle (+/+ mice) vs. TNBS (∆ββ/mice)], [, TNBS (+/+ mice) vs. TNBS (∆ββ/mice)], and [, vehicle (∆β/mice) vs. TNBS (∆ββ/mice)]; all p < 0.05, ANOVA followed by Tukey’s post-test; n = 6–12.
Figure 2
Figure 2
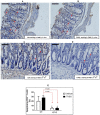
Effect of TNBS-induced CD on apoptosis of CD4+ cells in colons of +/+ andβ/∆β mice. Representative photomicrographs of CD4-stained and TUNEL-stained sections of colons (magnification 400×) derived from; (A,B) TNBS +/+ mice and (C,D) TNBS ∆β/∆β mice. Red arrows depict cells positively stained for CD4 or TUNEL. Scale bar on each micrograph represents 50 microns. CD4+ cells (500–1000 per section) within colon sections IHC stained for CD4 were assessed on the adjacent slide for TUNEL positivity or negativity. (E) The percentage TUNEL-positive cells expressed as mean ± SD ((*, TNBS (+/+ mice) vs. vehicle (∆β/∆β mice), , TNBS (+/+ mice) vs. TNBS (∆β/∆β mice), both p < 0.05, ANOVA followed by Tukey’s post-test; n = 3–4).
Figure 3
Figure 3
Effect of TTI-101 treatment on colon levels of pY-STAT3 protein, diarrhea, colonic bleeding, colon length, and colon inflammation in TNBS-induced CD. (A) pY-STAT3 levels were measured by Luminex assay in the colons of mice that received 50% ethanol or TNBS in 50% ethanol and treated with vehicle (DMSO) or TTI-101 in DMSO. pY-STAT3 levels were normalized to β-tubulin protein levels and the means ± SD of the ratios plotted. (B) Diarrheal score, (C,D) colonic bleeding, (E,F), colonic inflammation, and (G) colon length were assessed 48 hrs. post-administration of TNBS. Results are expressed as the mean ± SEM of two separate experiments ((A,B,D,G): *, Ethanol vs. TNBS, , Ethanol+TTI-101 vs. TNBS, and , TNBS vs. TNBS+TTI-101, all p < 0.05; ANOVA followed by Tukey’s post-test; n = 3–12), (F): *, TNBS vs. TNBS+TTI-101. p < 0.05; ANOVA followed by Tukey’s post-test; n = 6–12).
Figure 3
Figure 3
Effect of TTI-101 treatment on colon levels of pY-STAT3 protein, diarrhea, colonic bleeding, colon length, and colon inflammation in TNBS-induced CD. (A) pY-STAT3 levels were measured by Luminex assay in the colons of mice that received 50% ethanol or TNBS in 50% ethanol and treated with vehicle (DMSO) or TTI-101 in DMSO. pY-STAT3 levels were normalized to β-tubulin protein levels and the means ± SD of the ratios plotted. (B) Diarrheal score, (C,D) colonic bleeding, (E,F), colonic inflammation, and (G) colon length were assessed 48 hrs. post-administration of TNBS. Results are expressed as the mean ± SEM of two separate experiments ((A,B,D,G): *, Ethanol vs. TNBS, , Ethanol+TTI-101 vs. TNBS, and , TNBS vs. TNBS+TTI-101, all p < 0.05; ANOVA followed by Tukey’s post-test; n = 3–12), (F): *, TNBS vs. TNBS+TTI-101. p < 0.05; ANOVA followed by Tukey’s post-test; n = 6–12).
Figure 4
Figure 4
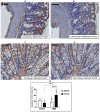
Effect of TTI-101 treatment on TNBS-induced apoptosis in CD4 cells. (A,B) Photomicrographs of CD4 and TUNEL stained sections of colon tissue derived from TNBS mice without TTI-101 treatment and from (C,D) TNBS mice with TTI-101 treatment, respectively (magnification 400×). Red arrows depict cells positively stained for CD4 or TUNEL. Scale bar on each micrograph represents 50 microns. (E) Percentage of apoptosis in colonic CD4+cells in response to TNBS, with and without TTI-101 treatment. Results are expressed as mean ± SD (*, Ethanol+TTI-101 vs. TNBS and , TNBS vs. TNBS+TTI-101; all p < 0.05, ANOVA followed by Tukey’s post-test; n = 3–4).
Figure 5
Figure 5
Effect of TTI-101 treatment on colonic Th17 cell infiltration. (A) Photomicrographs of Th17-stained sections of colons derived from control mice without TTI-101 treatment or (B) control mice with TTI-101 treatment or (C) TNBS mice without TTI-101 treatment, and (D) TNBS mice with TTI-101 treatment (magnification 400×). Red arrows depict cells positively stained for Th17. Scale bar on each micrograph represents 50 microns. (E) TTI-101 treatment significantly decreased levels of TNBS-induced colonic Th17 cell infiltration. Results are expressed as the mean ± SEM (average Th17 number in *, Ethanol vs. TNBS, , Ethanol+TTI-101 vs. TNBS and , TNBS vs. TNBS+TTI-101, all, p < 0.05, ANOVA followed by Tukey’s post-test) (n = 3–4).
Figure 5
Figure 5
Effect of TTI-101 treatment on colonic Th17 cell infiltration. (A) Photomicrographs of Th17-stained sections of colons derived from control mice without TTI-101 treatment or (B) control mice with TTI-101 treatment or (C) TNBS mice without TTI-101 treatment, and (D) TNBS mice with TTI-101 treatment (magnification 400×). Red arrows depict cells positively stained for Th17. Scale bar on each micrograph represents 50 microns. (E) TTI-101 treatment significantly decreased levels of TNBS-induced colonic Th17 cell infiltration. Results are expressed as the mean ± SEM (average Th17 number in *, Ethanol vs. TNBS, , Ethanol+TTI-101 vs. TNBS and , TNBS vs. TNBS+TTI-101, all, p < 0.05, ANOVA followed by Tukey’s post-test) (n = 3–4).

References

    1. Baumgart D.C., Sandborn W.J. Crohn’s disease. Lancet. 2012;380:1590–1605. doi: 10.1016/S0140-6736(12)60026-9. - DOI - PubMed
    1. Ha F., Khalil H. Crohn’s disease. A clinical update. Therap. Adv. Gastroenterol. 2015;8:352–359. doi: 10.1177/1756283X15592585. - DOI - PMC - PubMed
    1. Kalla R., Ventham N.T., Satsangi J., Arnott I.D. Crohn’s disease. BMJ. 2014;349:g6670. doi: 10.1136/bmj.g6670. - DOI - PubMed
    1. Juckett G., Trivedi R. Evaluation of chronic diarrhea. Am. Fam. Physician. 2011;84:1119–1126. - PubMed
    1. Sands B.E. From symptom to diagnosis: Clinical distinctions among various forms of intestinal inflammation. Gastroenterology. 2004;126:1518–1532. doi: 10.1053/j.gastro.2004.02.072. - DOI - PubMed