. 2022 Nov 22;23(23):14507.
doi: 10.3390/ijms232314507.

Transcriptional Profiling Provides New Insights into Organ Culture-Induced Changes in Human Donor Corneas

Affiliations

Transcriptional Profiling Provides New Insights into Organ Culture-Induced Changes in Human Donor Corneas

Julian Wolf et al. Int J Mol Sci. .

Abstract

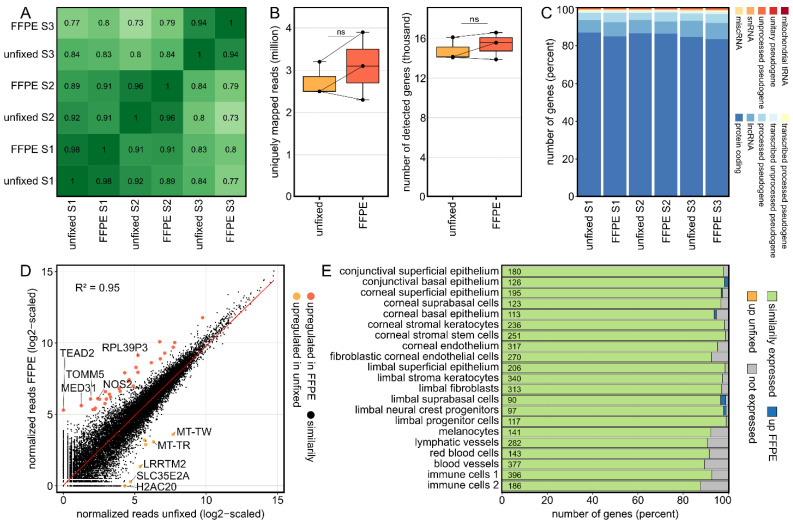
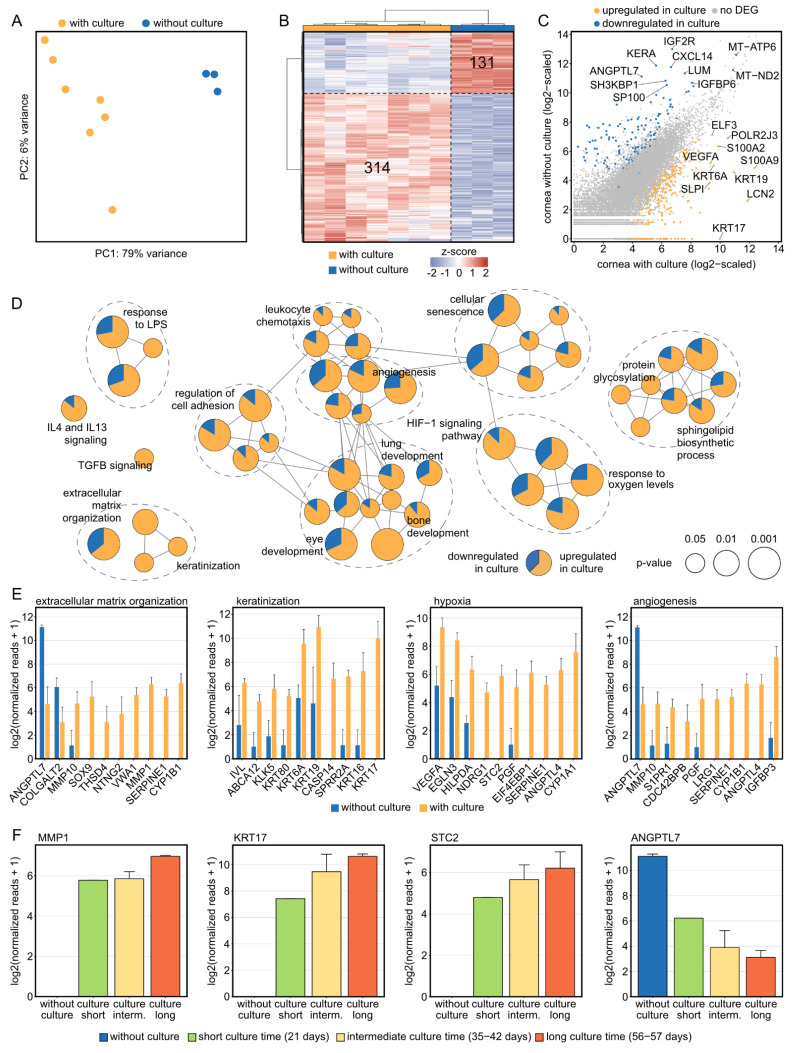
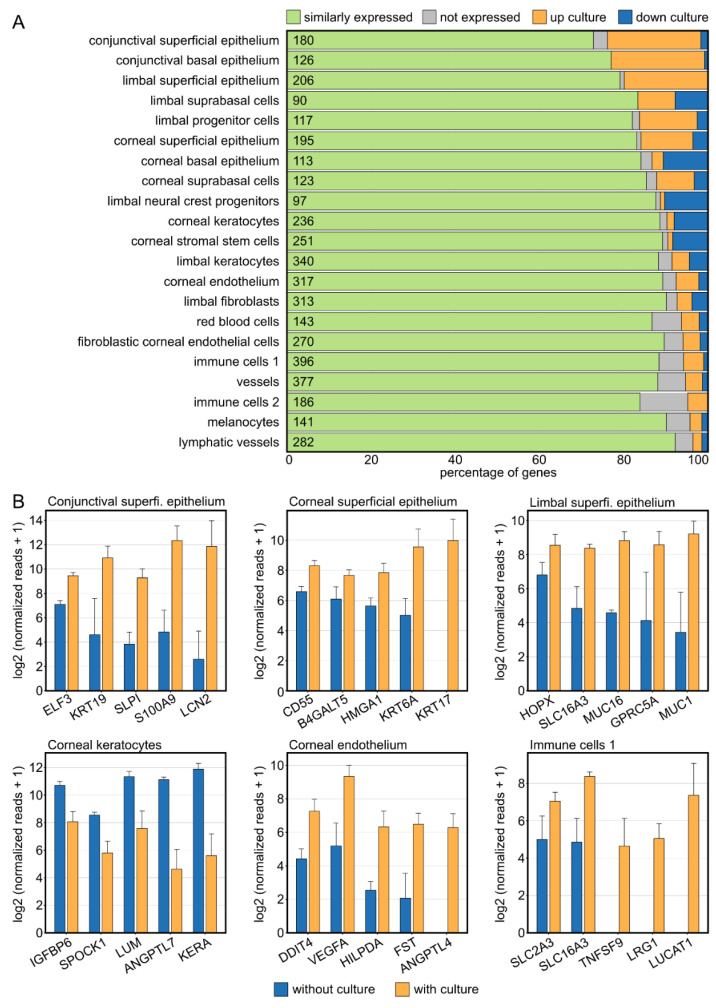
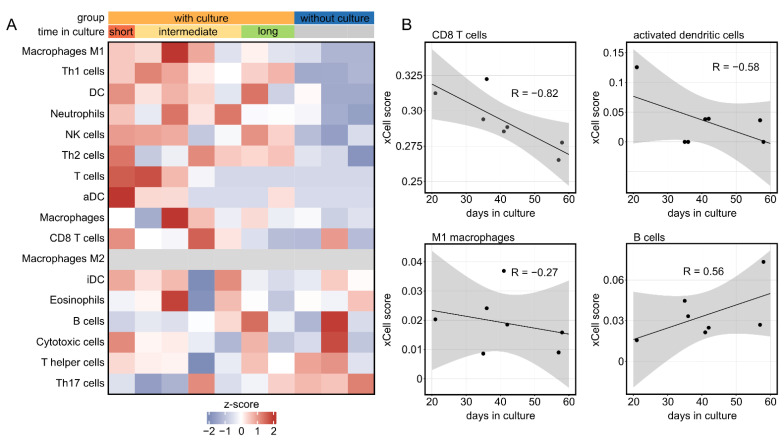
Corneal transplantation is one of the most common forms of tissue transplantation worldwide. Donor corneal tissue used in transplantation is provided by eye banks, which store the tissue in culture medium after procurement. To date, the effects of cell culture on human corneal tissue have not been fully elucidated. Using the 3' RNA sequencing method for massive analysis of cDNA ends (MACE), we show that cultivation of corneal tissue leads to significant changes in a variety of molecular processes in human corneal tissue that go well beyond aspects of previously known culture effects. Functionally grouped network analysis revealed nine major groups of biological processes that were affected by corneal organ culture, among them keratinization, hypoxia, and angiogenesis, with genes from each group being affected by culture time. A cell type deconvolution analysis revealed significant modulations of the corneal immune cell profile in a time dependent manner. The results suggest that current culture conditions should be further refined and that prolonged cultivation may be detrimental. Recently, we showed that MACE enables transcriptional profiling of formalin-fixed and paraffin-embedded (FFPE) conjunctival tissue with high accuracy even after more than 10 years of storage. Here we demonstrate that MACE provides comparable results for native and FFPE corneal tissue, confirming that the technology is suitable for transcriptome analysis of a wide range of archived diseased corneal samples stored in histological archives. Finally, our data underscore the feasibility of bioinformatics cell-type enrichment analysis in bulk RNA-seq data to profile immune cell composition in fixed and archived corneal tissue samples, for which RNA-seq analysis of individual cells is often not possible.

Keywords: RNA sequencing; cornea; corneal graft; corneal transplantation; eye bank; formalin-fixed paraffin-embedded; organ culture.


Conflict of interest statement

The authors declare no conflict of interest.

Figures

Figure 1
Figure 1
Formalin fixation does not have a significant impact on the transcriptional profile of human corneas. (A): The overall correlation coefficients between all analyzed samples revealed that the interindividual variability between the three corneas exceeded the influence of FFPE fixation, with correlation coefficients ranging from 0.94 to 0.98 between the fixed and unfixed corneal halves. FFPE: formalin fixation and paraffin embedding. (B): The number of uniquely mapped reads as well as the number of detected genes were comparable between fixed and unfixed corneas. The cross lines connect the respective divided sample pairs. ns: not significant. (C): Similarly, the proportion of different gene types such as protein coding genes or lncRNA was comparable between fixed and unfixed samples. lncRNA: long non-coding RNA; miscRNA: miscellaneous RNA; snRNA: small nuclear RNA; tRNA: transfer RNA. (D): Readplot visualizing differentially expressed genes (DEG) between fixed and unfixed samples. In total, there were 39,585 transcripts (99.91%) with similar expression between the two groups, with only 28 (0.07%) and 7 (0.02%) genes being up- and downregulated by fixation, respectively. The overall squared correlation coefficient (R2) between fixed and unfixed samples was 0.95. The red line corresponds to the regression line. The top five DEG per group are labeled. (E): Impact of FFPE processing on the expression profile of corneal cell type-specific marker genes, as previously determined by single-cell RNA sequencing. The number of marker genes for each cell type is shown within the plot.
Figure 2
Figure 2
Corneal tissue culture significantly modulates the transcriptional profile of human corneas. (A) The substantial effect of organ culture is illustrated by unsupervised cluster analysis using principal component analysis. PC: principal component. (B): Heatmap visualizing the 314 significantly up- and 131 significantly downregulated genes by tissue culture. The z-score represents a gene’s expression in relation to its mean expression by standard deviation units (red: upregulation, blue: downregulation). (C): Readplot visualizing differentially expressed genes (DEG) between corneas with and without culture. The top 10 DEG per group are labeled. (D): Functionally grouped network analysis of enriched Gene Ontology biological processes, reactome, KEGG, and Wiki pathways in which the DEG were involved in. Enriched terms are visualized as nodes being linked based on their kappa score, which indicates the similarity of the genes linked to them. The node size represents the term enrichment significance (see legend). Representative terms of each group are labeled. The pie charts visualize the percentage of up- and downregulated genes. (E) The top ten DEG, which were selected based on the absolute value of the log2 fold change, are visualized for each subnetwork from (D). The height of the bar corresponds to mean expression and the error bar represents standard deviation. (F) Changes of expression in dependence of time in organ culture for genes of each subnetwork from (E). Number of samples per group: without culture, 3; short culture time, 1; intermediate culture time, 4; long culture time, 2.
Figure 3
Figure 3
Corneal tissue culture significantly modulates the corneal cellular composition. (A): Impact of tissue culture on the expression profile of corneal cell type-specific marker genes, as previously determined by single-cell RNA sequencing. The number of marker genes for each cell type is shown within the plot. (B): The top five differentially expressed cell-type-specific marker genes are visualized for the most affected cell types. The height of the bar corresponds to mean expression and the error bar represents standard deviation.
Figure 4
Figure 4
The corneal immune cell profile significantly changes in tissue culture in a time-dependent manner. (A): Immune cell profile of cultured human corneas characterized by cell-type enrichment analysis using xCell. The tool uses gene expression profiles of several immune cell types to calculate cell type enrichment scores. Each row represents one cell type, and each column represents one sample. The analysis revealed a significant influence of the culture in a time-dependent manner. Time in culture: short, 21 days; intermediate, 35–42 days; long, 56–57 days. (B): The influence of time in culture on the immune cell profile is illustrated by four immune cell populations.

References

    1. Swamy V., McGaughey D. Eye in a Disk: EyeIntegration Human Pan-Eye and Body Transcriptome Database Version 1.0. Investig. Ophthalmol. Vis. Sci. 2019;60:3236–3246. doi: 10.1167/iovs.19-27106. - DOI - PMC - PubMed
    1. Wolf J., Boneva S., Schlecht A., Lapp T., Auw-Haedrich C., Lagrèze W., Agostini H., Reinhard T., Schlunck G., Lange C. The Human Eye Transcriptome Atlas: A searchable comparative transcriptome database for healthy and diseased human eye tissue. Genomics. 2022;114:110286. doi: 10.1016/j.ygeno.2022.110286. - DOI - PubMed
    1. Collin J., Queen R., Zerti D., Bojic S., Dorgau B., Moyse N., Molina M.M., Yang C., Dey S., Reynolds G., et al. A single cell atlas of human cornea that defines its development, limbal progenitor cells and their interactions with the immune cells. Ocul. Surf. 2021;21:279–298. doi: 10.1016/j.jtos.2021.03.010. - DOI - PMC - PubMed
    1. Boneva S., Schlecht A., Böhringer D., Mittelviefhaus H., Reinhard T., Agostini H., Auw-Haedrich C., Schlunck G., Wolf J., Lange C. 3′ MACE RNA-sequencing allows for transcriptome profiling in human tissue samples after long-term storage. Lab. Investig. 2020;100:1345–1355. doi: 10.1038/s41374-020-0446-z. - DOI - PMC - PubMed
    1. EEBA Minimum Medical Standards (MMS). Published Online 1 February 2020. [(accessed on 31 May 2022)]. Available online: https://www.eeba.eu/files/pdf/EEBA%20Minimum%20Medical%20Standards%20Rev....

Substances