. 2022 Nov 23;23(23):14586.
doi: 10.3390/ijms232314586.

19S Proteasome Subunits as Oncogenes and Prognostic Biomarkers in FLT3-Mutated Acute Myeloid Leukemia (AML)

Affiliations

19S Proteasome Subunits as Oncogenes and Prognostic Biomarkers in FLT3-Mutated Acute Myeloid Leukemia (AML)

Joshua J Lara et al. Int J Mol Sci. .

Abstract

26S proteasome non-ATPase subunits 1 (PSMD1) and 3 (PSMD3) were recently identified as prognostic biomarkers and potential therapeutic targets in chronic myeloid leukemia (CML) and multiple solid tumors. In the present study, we analyzed the expression of 19S proteasome subunits in acute myeloid leukemia (AML) patients with mutations in the FMS-like tyrosine kinase 3 (FLT3) gene and assessed their impact on overall survival (OS). High levels of PSMD3 but not PSMD1 expression correlated with a worse OS in FLT3-mutated AML. Consistent with an oncogenic role for PSMD3 in AML, shRNA-mediated PSMD3 knockdown impaired colony formation of FLT3+ AML cell lines, which correlated with increased OS in xenograft models. While PSMD3 regulated nuclear factor-kappa B (NF-κB) transcriptional activity in CML, we did not observe similar effects in FLT3+ AML cells. Rather, proteomics analyses suggested a role for PSMD3 in neutrophil degranulation and energy metabolism. Finally, we identified additional PSMD subunits that are upregulated in AML patients with mutated versus wild-type FLT3, which correlated with worse outcomes. These findings suggest that different components of the 19S regulatory complex of the 26S proteasome can have indications for OS and may serve as prognostic biomarkers in AML and other types of cancers.

Keywords: FMS-like tyrosine kinase 3 (FLT3); acute myeloid leukemia (AML); proteasome 26S subunit non-ATPase 3 (PSMD3); proteasome inhibition.


Conflict of interest statement

The authors declare no conflict of interest.

Figures

Figure 1
Figure 1
High levels of PSMD3 but not PSMD1 mRNA expression correlated with worse overall survival (OS) in FLT3-mutated AML. (A) The box plot shows PSMD1 expression in AML versus normal mononuclear cells (MNCs) from GEPIA2. Error bars represent standard error of the mean (SEM, p = ns). (B,C) Kaplan–Meier curves show the effect of PSMD1 mRNA expression on OS in AML when all subtypes are considered (B) and in FLT3-mutated AML (C) from UALCAN. (D) The box plot shows PSMD3 expression in AML versus normal MNCs from GEPIA2. Error bars represent SEM (* p < 0.001). (E,F) Kaplan–Meier curves show the effect of PSMD3 mRNA expression on OS in AML when all subtypes are considered (E) and in FLT3-mutated AML (F) from UALCAN.
Figure 2
Figure 2
shRNA-mediated PSMD3 (shPSMD3) knockdown impaired survival of the FLT3-mutated AML cell lines, MOLM-13 and MV4-11, with variable effects on apoptosis. (A,B) Bar graphs and immunoblots show PSMD3 knockdown at the mRNA and protein level, respectively, in MOLM-13 (A) and MV4-11 (B) cells cultured with and without doxycycline (DOX, 100 ng/mL, 72 h). (C,D) Bar graphs show the effect of shPSMD3 on survival in colony formation (left) and late apoptosis (right) in MOLM-13 (C) and MV4-11 (D) cells cultured ± doxycycline (DOX, 100 ng/mL, 72 h) and ± quizartinib (AC220, 20 nM, 72 h). Error bars represent SEM (* p < 0.05; ** p < 0.01; *** p < 0.001).
Figure 3
Figure 3
shPSMD3 enhanced survival of MOLM-13 cells engrafted into NOD-scid IL2Rgammanull (NSG) recipient mice. Kaplan–Meier curve shows overall survival (OS) of sublethally irradiated NSG recipient mice upon intravenous injection of MOLM-13 cells (3 × 10⁶) expressing either shPSMD3 (n = 5) or the non-targeting shNT control vector (n = 4) and treated with doxycycline (DOX, 625 mg/kg).
Figure 4
Figure 4
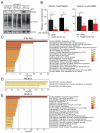
PSMD3 knockdown in FLT3+ AML increased global ubiquitylated proteins, but had little effect on NF-κB luciferase reporter activity. (A) Immunoblot shows the effect of PSMD3 knockdown (shPSMD3) on global protein ubiquitylation in MOLM-13, MOLM-14, and MV4-11 cells. GAPDH levels were measured as a control. (B) Bar graphs show the effect of PSMD3 knockdown combined with the FLT3 TKI, quizartinib (AC220, 20 nM, 72 h), on NF-κB luciferase reporter activity in MOLM-13 (left) and MOLM-14 (right) cells. Error bars represent SEM (* p < 0.05; ** p < 0.01). (C) Bar graph shows pathway enrichment analysis of the gene sets upregulated with PSMD3 expression in AML data from The Cancer Genome Atlas (TCGA) available at UALCAN (http://ualcan/path.uab.edu/, accessed on 30 July 2021). (D,E) Bar graphs show pathway enrichment analysis of the proteins that were dysregulated upon shRNA-mediated PSMD3 knockdown in the MOLM-13 (D) and MOLM-14 (E) AML cell lines, as measured by mass spectrometry-based proteomics analyses. The darkness of the orange color reflects the p-value, with darker colors having greater significance.
Figure 5
Figure 5
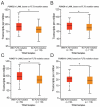
Correlation of PSMD2, PSMD6, PSMD7, and PSMD9 mRNA expression with FLT3 mutation status in AML. (AD) We used TCGA data available at UALCAN to associate the expression of other PSMD subunits with OS in AML. The box plots demonstrate that mRNA encoding PSMD2 (A), PSMD6 (B), PSMD7 (C), and PSMD9 (D) were significantly elevated in AML patients with mutated versus wild-type FLT3. Error bars represent SEM (* p < 0.05).
Figure 6
Figure 6
High levels of PSMD2 and PSMD7 mRNA expression correlated with worse outcomes in FLT3-mutated AML. (AD) Box plots show PSMD2 (A), PSMD6 (B), PSMD7 (C), and PSMD9 (D) mRNA expression in AML versus normal MNCs. (EH) Kaplan–Meier curves show OS for AML patients with high versus low levels of PSMD2 (E), PSMD6 (F), PSMD7 (G), and PSMD9 (H) when all AML subtypes are considered. (IL) Kaplan–Meier curves show OS for FLT3-mutated AML patients with high versus low levels of PSMD2 (I), PSMD6 (J), PSMD7 (K), and PSMD9 (L). Error bars represent SEM (* p < 0.001).

References

    1. Daver N., Schlenk R.F., Russell N.H., Levis M.J. Targeting FLT3 mutations in AML: Review of current knowledge and evidence. Leukemia. 2019;33:299–312. doi: 10.1038/s41375-018-0357-9. - DOI - PMC - PubMed
    1. McKenna H.J., Stocking K.L., Miller R.E., Brasel K., De Smedt T., Maraskovsky E., Maliszewski C.R., Lynch D.H., Smith J., Pulendran B., et al. Mice lacking flt3 ligand have deficient hematopoiesis affecting hematopoietic progenitor cells, dendritic cells, and natural killer cells. Blood. 2000;95:3489–3497. doi: 10.1182/blood.V95.11.3489. - DOI - PubMed
    1. Stone R.M., Mandrekar S.J., Sanford B.L., Laumann K., Geyer S., Bloomfield C.D., Thiede C., Prior T.W., Döhner K., Marcucci G., et al. Midostaurin plus Chemotherapy for Acute Myeloid Leukemia with a FLT3 Mutation. N. Engl. J. Med. 2017;377:454–464. doi: 10.1056/NEJMoa1614359. - DOI - PMC - PubMed
    1. Perl A.E., Martinelli G., Cortes J.E., Neubauer A., Berman E., Paolini S., Montesinos P., Baer M.R., Larson R.A., Ustun C., et al. Gilteritinib or Chemotherapy for Relapsed or Refractory FLT3-Mutated AML. N. Engl. J. Med. 2019;381:1728–1740. doi: 10.1056/NEJMoa1902688. - DOI - PubMed
    1. Ambinder A.J., Levis M. Potential targeting of FLT3 acute myeloid leukemia. Haematologica. 2021;106:671–681. doi: 10.3324/haematol.2019.240754. - DOI - PMC - PubMed

Substances