

Hepatic Oleate Regulates Insulin-like Growth Factor-Binding Protein 1 Partially through the mTORC1-FGF21 Axis during High-Carbohydrate Feeding
- PMID: 36498997
- PMCID: PMC9737156
- DOI: 10.3390/ijms232314671
Hepatic Oleate Regulates Insulin-like Growth Factor-Binding Protein 1 Partially through the mTORC1-FGF21 Axis during High-Carbohydrate Feeding
Abstract
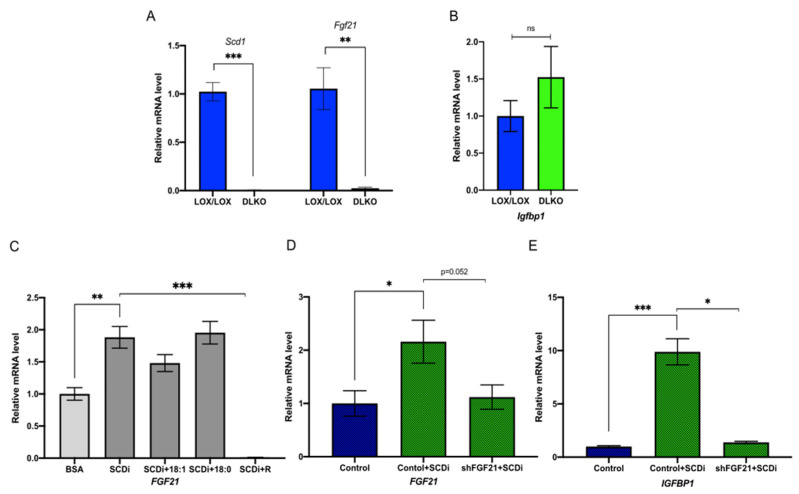
Stearoyl-CoA desaturase-1 (SCD1) catalyzes the rate-liming step of monounsaturated fatty acid biosynthesis and is a key regulator of systemic glucose metabolism. Mice harboring either a global (GKO) or liver-specific deletion (LKO) of Scd1 display enhanced insulin signaling and whole-body glucose uptake. Additionally, GKO and LKO mice are protected from high-carbohydrate diet-induced obesity. Given that high-carbohydrate diets can lead to chronic metabolic diseases such as obesity, diabetes, and hepatic steatosis, it is critical to understand how Scd1 deficiency confers metabolically beneficial phenotypes. Here we show that insulin-like growth factor-binding protein 1 (IGFBP1), a hepatokine that has been reported to enhance insulin signaling, is significantly elevated in the liver and plasma of GKO and LKO mice fed a low-fat high-carbohydrate diet. We also observed that the expression of hepatic Igfbp1 is regulated by oleic acid (18:1n9), a product of SCD1, through the mTORC1-FGF21 axis both in vivo and in vitro.
Keywords: fibroblast growth factor 21; insulin-like growth factor-binding protein 1; mechanistic target of rapamycin; oleic acid; stearic acid; stearoyl-CoA desaturase-1.
Conflict of interest statement
The authors do not have any conflict of interest to declare.
Figures


Similar articles
-
Hepatic stearoyl CoA desaturase 1 deficiency increases glucose uptake in adipose tissue partially through the PGC-1α-FGF21 axis in mice.J Biol Chem. 2019 Dec 20;294(51):19475-19485. doi: 10.1074/jbc.RA119.009868. Epub 2019 Nov 5. J Biol Chem. 2019. PMID: 31690632 Free PMC article.
-
Hepatic stearoyl-CoA desaturase-1 deficiency protects mice from carbohydrate-induced adiposity and hepatic steatosis.Cell Metab. 2007 Dec;6(6):484-96. doi: 10.1016/j.cmet.2007.10.014. Cell Metab. 2007. PMID: 18054317
-
Hepatic Stearoyl-CoA desaturase-1 deficiency-mediated activation of mTORC1- PGC-1α axis regulates ER stress during high-carbohydrate feeding.Sci Rep. 2019 Oct 31;9(1):15761. doi: 10.1038/s41598-019-52339-7. Sci Rep. 2019. PMID: 31673045 Free PMC article.
-
Role of Oleic Acid in the Gut-Liver Axis: From Diet to the Regulation of Its Synthesis via Stearoyl-CoA Desaturase 1 (SCD1).Nutrients. 2019 Sep 24;11(10):2283. doi: 10.3390/nu11102283. Nutrients. 2019. PMID: 31554181 Free PMC article. Review.
-
Stearoyl-CoA desaturase and its relation to high-carbohydrate diets and obesity.Biochim Biophys Acta. 2009 Feb;1791(2):85-91. doi: 10.1016/j.bbalip.2008.12.011. Epub 2009 Jan 2. Biochim Biophys Acta. 2009. PMID: 19166967 Free PMC article. Review.
Cited by
-
Glucogenic Precursor Release from Dietary Supply Is a Potential Amplifier of Monosodium-Glutamate Ovary Stimuli in Sheep with Low Involving Key Gene Mediators of the Glutamate Pathway.Animals (Basel). 2025 Aug 11;15(16):2345. doi: 10.3390/ani15162345. Animals (Basel). 2025. PMID: 40867673 Free PMC article.
References
-
- Ng M., Fleming T., Robinson M., Thomson B., Graetz N., Margono C., Mullany E.C., Biryukov S., Abbafati C., Abera S.F., et al. Global, regional, and national prevalence of overweight and obesity in children and adults during 1980-2013: A systematic analysis for the Global Burden of Disease Study 2013. Lancet. 2014;384:766–781. doi: 10.1016/S0140-6736(14)60460-8. - DOI - PMC - PubMed
MeSH terms
Substances
Grants and funding
LinkOut - more resources
Full Text Sources
Research Materials
