

Transcriptomics Profiling of Acer pseudosieboldianum Molecular Mechanism against Freezing Stress
- PMID: 36499002
- PMCID: PMC9737005
- DOI: 10.3390/ijms232314676
Transcriptomics Profiling of Acer pseudosieboldianum Molecular Mechanism against Freezing Stress
Abstract
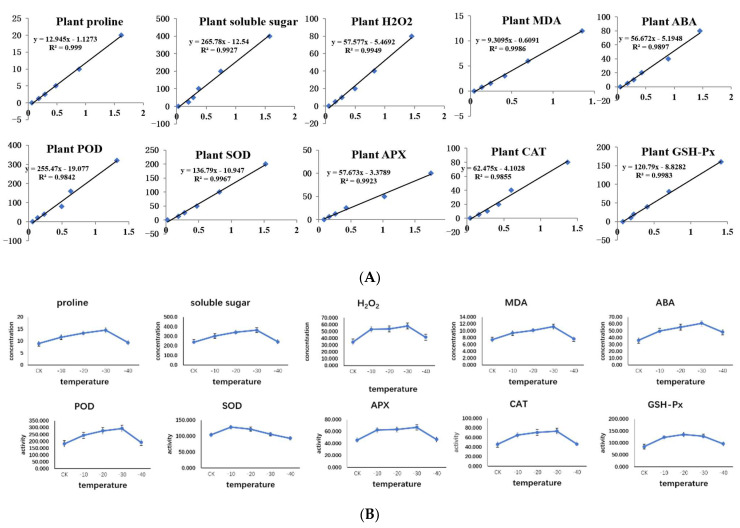
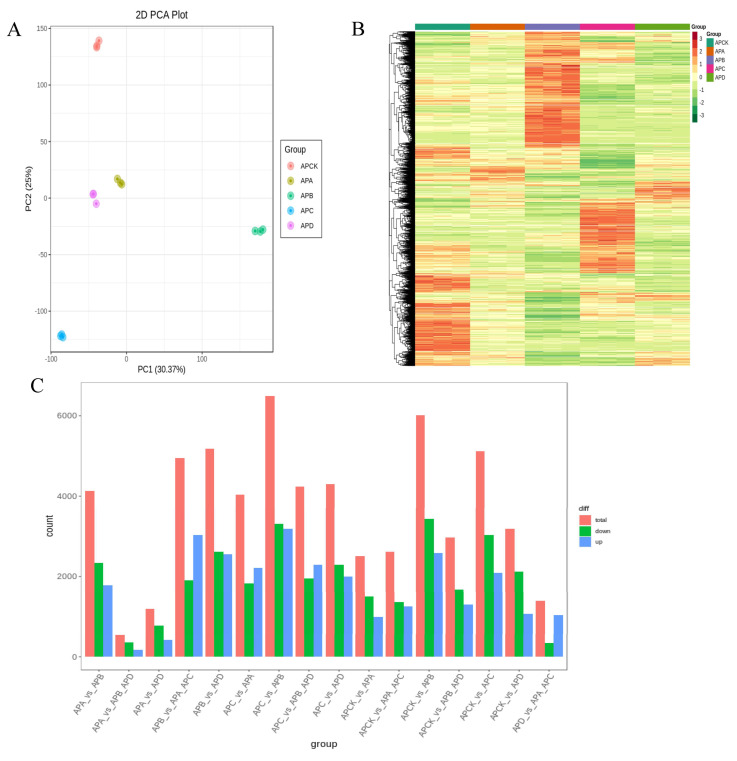
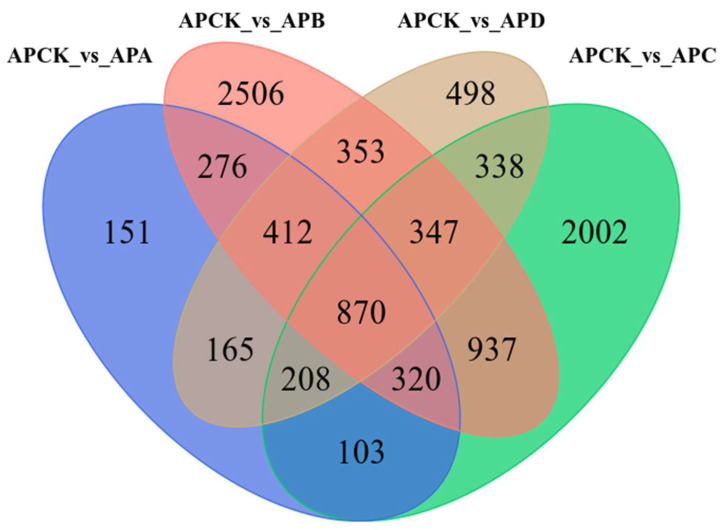
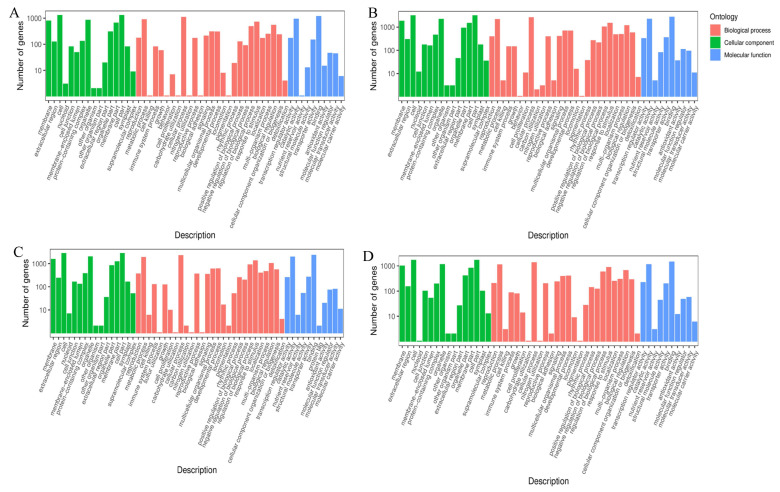
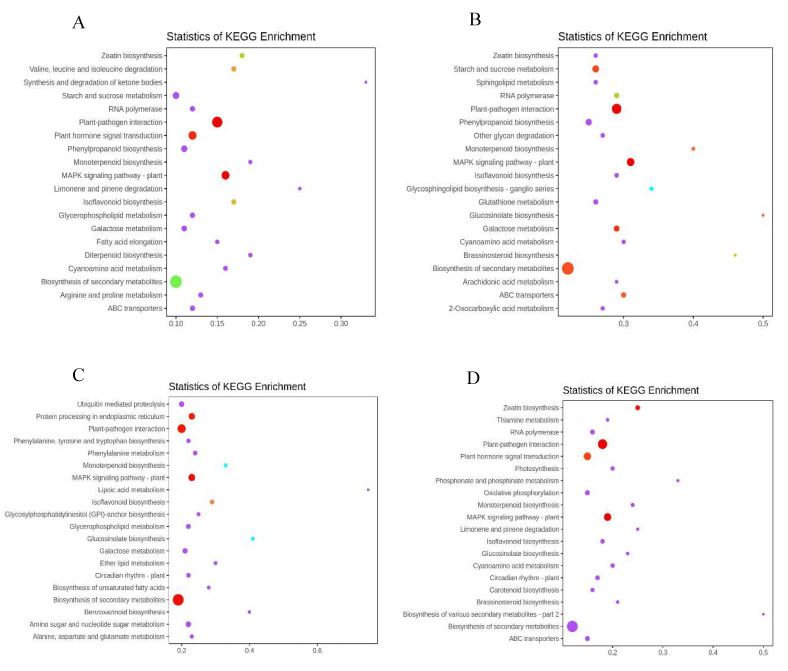
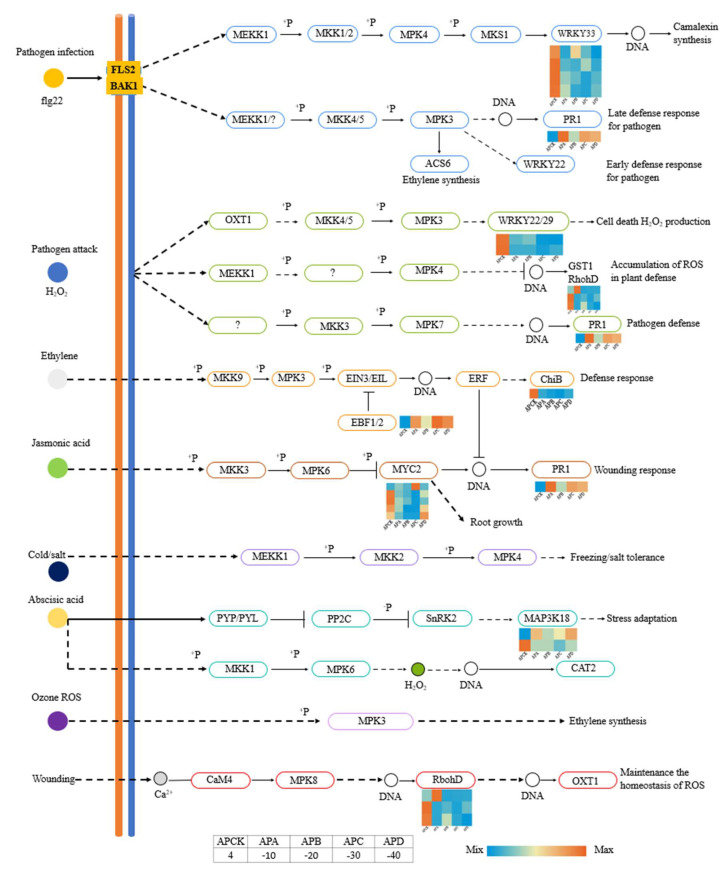
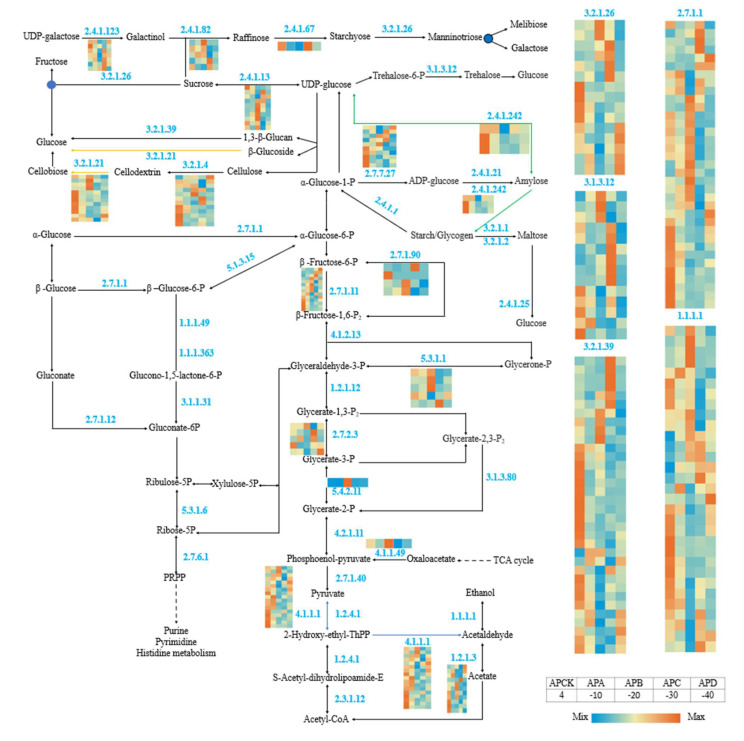
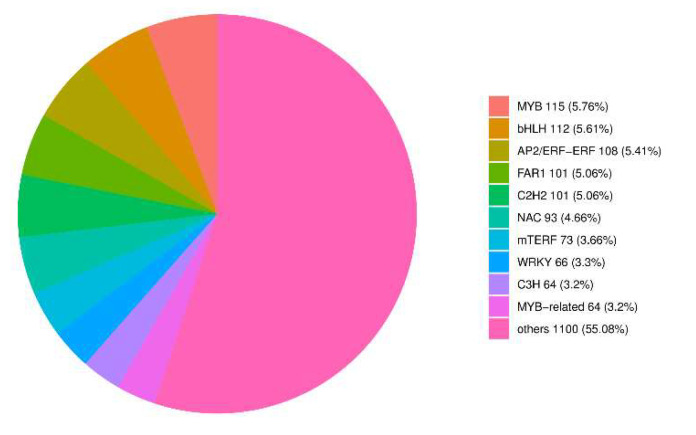
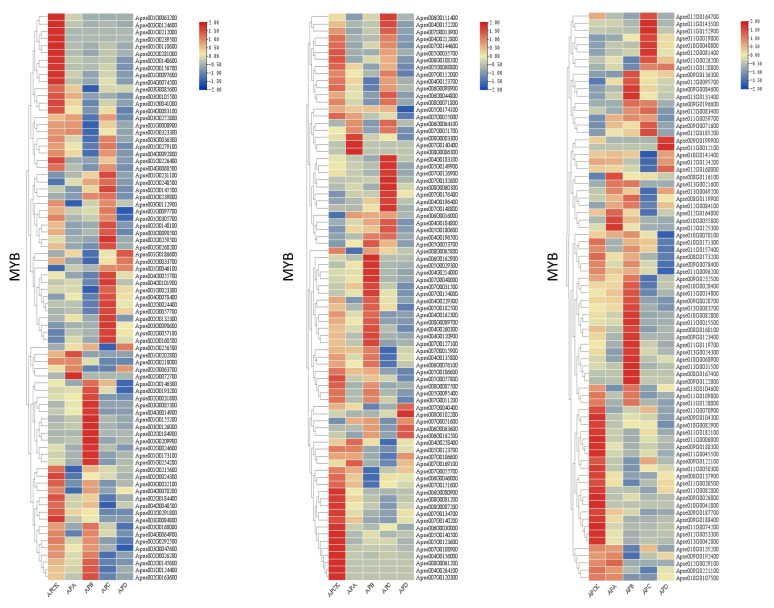
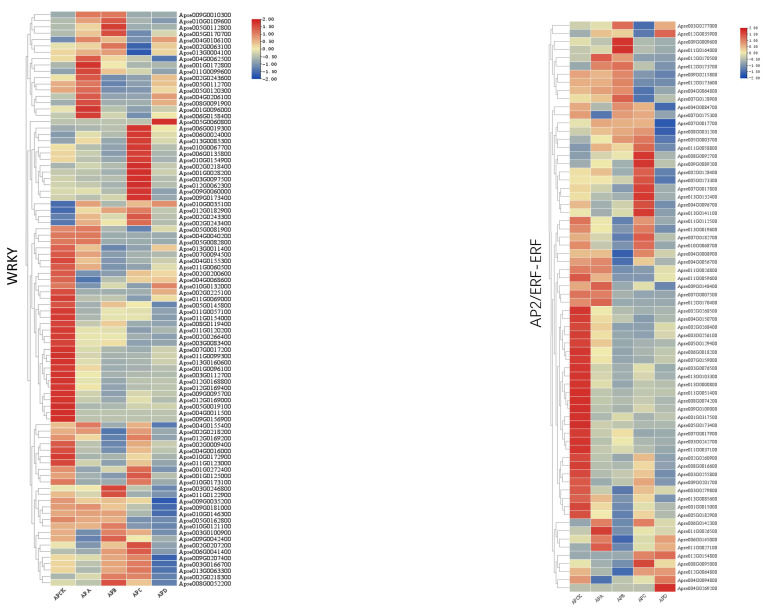
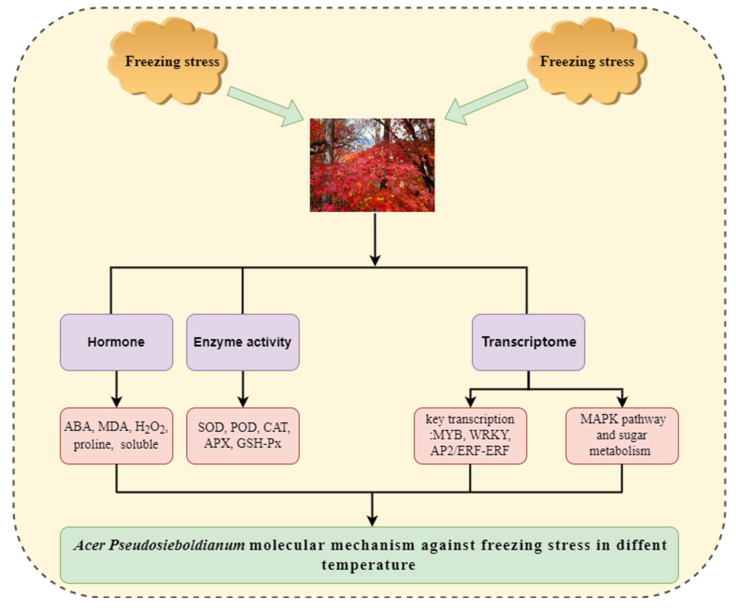
Low temperature is an important environmental factor that affects the growth and development of trees and leads to the introduction of failure in the genetic improvement of trees. Acer pseudosieboldianum is a tree species that is well-known for its bright red autumn leaf color. These trees are widely used in landscaping in northeast China. However, due to their poor cold resistance, introduced A. pseudosieboldianum trees suffer severe freezing injury in many introduced environments. To elucidate the physiological indicators and molecular mechanisms associated with freezing damage, we analyzed the physiological indicators and transcriptome of A. pseudosieboldianum, using kits and RNA-Seq technology. The mechanism of A. pseudosieboldianum in response to freezing stress is an important scientific question. In this study, we used the shoots of four-year-old A. pseudosieboldianum twig seedlings, and the physiological index and the transcriptome of A. pseudosieboldianum under low temperature stress were investigated. The results showed that more than 20,000 genes were detected in A. pseudosieboldianum under low temperature (4 °C) and freezing temperatures (-10 °C, -20 °C, -30 °C, and -40 °C). There were 2505, 6021, 5125, and 3191 differential genes (DEGs) between -10 °C, -20°C, -30°C, -40 °C, and CK (4 °C), respectively. Among these differential genes, 48 genes are involved in the MAPK pathway and 533 genes are involved in the glucose metabolism pathway. In addition, the important transcription factors (MYB, AP2/ERF, and WRKY) involved in freezing stress were activated under different degrees of freezing stress. A total of 10 sets of physiological indicators of A. pseudosieboldianum were examined, including the activities of five enzymes and the accumulation of five hormones. All of the physiological indicators except SOD and GSH-Px reached their maximum values at -30 °C. The enzyme activity of SOD was highest at -10 °C, and that of GSH-Px was highest at -20 °C. Our study is the first to provide a more comprehensive understanding of the differential genes (DEGs) involved in A. pseudosieboldianum under freezing stress at different temperatures at the transcriptome level. These results may help to clarify the molecular mechanism of cold tolerance of A. pseudosieboldianum and provide new insights and candidate genes for the genetic improvement of the freezing tolerance of A. pseudosieboldianum.
Keywords: Acer pseudosieboldianum; DEGs; RNA-seq; freezing stress.
Conflict of interest statement
The authors declare no conflict of interest.
Figures
Similar articles
-
Genome-wide identification and functional analysis of R2R3-MYB genes in Acer pseudosieboldianum: insights into low temperature stress response and anthocyanin biosynthesis.BMC Plant Biol. 2025 Jul 2;25(1):795. doi: 10.1186/s12870-025-06782-6. BMC Plant Biol. 2025. PMID: 40596834 Free PMC article.
-
De novo transcriptome revealed genes involved in anthocyanin biosynthesis, transport, and regulation in a mutant of Acer pseudosieboldianum.BMC Genomics. 2022 Aug 8;23(1):567. doi: 10.1186/s12864-022-08815-y. BMC Genomics. 2022. PMID: 35941547 Free PMC article.
-
De novo transcriptome sequencing and anthocyanin metabolite analysis reveals leaf color of Acer pseudosieboldianum in autumn.BMC Genomics. 2021 May 25;22(1):383. doi: 10.1186/s12864-021-07715-x. BMC Genomics. 2021. PMID: 34034673 Free PMC article.
-
Anthocyanin metabolites and related regulatory genes analysis in leaves of Acer Pseudosieboldianum mutant during different periods of color change.BMC Genomics. 2025 Feb 22;26(1):182. doi: 10.1186/s12864-025-11378-3. BMC Genomics. 2025. PMID: 39987037 Free PMC article.
-
Comparative transcriptome profiling reveals cold stress responsiveness in two contrasting Chinese jujube cultivars.BMC Plant Biol. 2020 May 27;20(1):240. doi: 10.1186/s12870-020-02450-z. BMC Plant Biol. 2020. PMID: 32460709 Free PMC article.
Cited by
-
Integration of Metabolome and Transcriptome Reveals the Major Metabolic Pathways and Potential Biomarkers in Response to Freeze-Stress Regulation in Apple (Malus domestica).Metabolites. 2023 Jul 27;13(8):891. doi: 10.3390/metabo13080891. Metabolites. 2023. PMID: 37623835 Free PMC article.
-
Genome-wide identification and functional analysis of R2R3-MYB genes in Acer pseudosieboldianum: insights into low temperature stress response and anthocyanin biosynthesis.BMC Plant Biol. 2025 Jul 2;25(1):795. doi: 10.1186/s12870-025-06782-6. BMC Plant Biol. 2025. PMID: 40596834 Free PMC article.
-
cDNA Cloning, Bioinformatics, and Expression Analysis of ApsANS in Acer pseudosieboldianum.Int J Mol Sci. 2025 Feb 21;26(5):1865. doi: 10.3390/ijms26051865. Int J Mol Sci. 2025. PMID: 40076492 Free PMC article.
References
-
- Yang J., Muhammad W.H., Tao L., Zhang R., Yun Q., Peter H., Zhiling D., Luo G., Guo H., Ma Y. De novo genome assembly of the endangered Acer yangbiense, a plant species with extremely small populations endemic to Yunnan Province, China. GigaScience. 2019;7:giz085. doi: 10.1093/gigascience/giz085. - DOI - PMC - PubMed
-
- Grossman J.J. Evidence of Constrained Divergence and Conservatism in Climatic Niches of the Temperate Maples (Acer L.) Forests. 2021;12:535. doi: 10.3390/f12050535. - DOI
-
- Gelderen D., Jong P., Oterdoom H.J. Maples of the World. Timber Press; Portland, OR, USA: 1994.
-
- Zhu Z., Lin L. Studies on Germplasm Resources and Cultivation Techniques of Maple. Science Press; Shanghai, China: 2014.
MeSH terms
Grants and funding
LinkOut - more resources
Full Text Sources
Research Materials
