

Acid Sphingomyelinase Inhibitor, Imipramine, Reduces Hippocampal Neuronal Death after Traumatic Brain Injury
- PMID: 36499076
- PMCID: PMC9740309
- DOI: 10.3390/ijms232314749
Acid Sphingomyelinase Inhibitor, Imipramine, Reduces Hippocampal Neuronal Death after Traumatic Brain Injury
Abstract
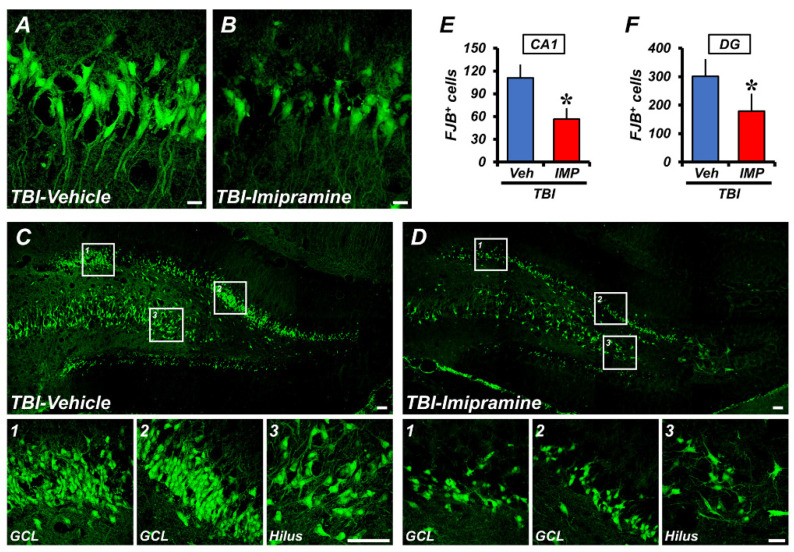
Traumatic brain injury (TBI) broadly degrades the normal function of the brain after a bump, blow, or jolt to the head. TBI leads to the aggravation of pre-existing brain dysfunction and promotes neurotoxic cascades that involve processes such as oxidative stress, loss of dendritic arborization, and zinc accumulation. Acid sphingomyelinase (ASMase) is an enzyme that hydrolyzes sphingomyelin to ceramide in cells. Under normal conditions, ceramide plays an important role in various physiological functions, such as differentiation and apoptosis. However, under pathological conditions, excessive ceramide production is toxic and activates the neuronal-death pathway. Therefore, we hypothesized that the inhibition of ASMase activity by imipramine would reduce ceramide formation and thus prevent TBI-induced neuronal death. To test our hypothesis, an ASMase inhibitor, imipramine (10 mg/kg, i.p.), was administrated to rats immediately after TBI. Based on the results of this study, we confirmed that imipramine significantly reduced ceramide formation, dendritic loss, oxidative stress, and neuronal death in the TBI-imipramine group compared with the TBI-vehicle group. Additionally, we validated that imipramine prevented TBI-induced cognitive dysfunction and the modified neurological severity score. Consequently, we suggest that ASMase inhibition may be a promising therapeutic strategy to reduce hippocampal neuronal death after TBI.
Keywords: acid sphingomyelinase; ceramide; imipramine; neuronal death; traumatic brain injury.
Conflict of interest statement
The authors declare that they have no conflict of interest in this study.
Figures


Similar articles
-
Imipramine, an Acid Sphingomyelinase Inhibitor, Promotes Newborn Neuron Survival in the Hippocampus After Seizure.Cells. 2025 Feb 14;14(4):281. doi: 10.3390/cells14040281. Cells. 2025. PMID: 39996753 Free PMC article.
-
Administration of an Acidic Sphingomyelinase (ASMase) Inhibitor, Imipramine, Reduces Hypoglycemia-Induced Hippocampal Neuronal Death.Cells. 2022 Feb 14;11(4):667. doi: 10.3390/cells11040667. Cells. 2022. PMID: 35203316 Free PMC article.
-
Imipramine blocks ethanol-induced ASMase activation, ceramide generation, and PP2A activation, and ameliorates hepatic steatosis in ethanol-fed mice.Am J Physiol Gastrointest Liver Physiol. 2012 Mar 1;302(5):G515-23. doi: 10.1152/ajpgi.00455.2011. Epub 2011 Dec 22. Am J Physiol Gastrointest Liver Physiol. 2012. PMID: 22194417 Free PMC article.
-
The acid sphingomyelinase/ceramide pathway: biomedical significance and mechanisms of regulation.Curr Mol Med. 2010 Jul;10(5):454-66. doi: 10.2174/156652410791608225. Curr Mol Med. 2010. PMID: 20540705 Review.
-
The relevance of acid sphingomyelinase as a potential target for therapeutic intervention in hepatic disorders: current scenario and anticipated trends.Arch Toxicol. 2023 Aug;97(8):2069-2087. doi: 10.1007/s00204-023-03529-w. Epub 2023 May 29. Arch Toxicol. 2023. PMID: 37248308 Free PMC article. Review.
Cited by
-
Sphingolipid changes in mouse brain and plasma after mild traumatic brain injury at the acute phases.Lipids Health Dis. 2024 Jun 27;23(1):200. doi: 10.1186/s12944-024-02186-x. Lipids Health Dis. 2024. PMID: 38937745 Free PMC article.
-
Raman Spectroscopy Spectral Fingerprints of Biomarkers of Traumatic Brain Injury.Cells. 2023 Nov 8;12(22):2589. doi: 10.3390/cells12222589. Cells. 2023. PMID: 37998324 Free PMC article.
-
Neurotrauma-From Injury to Repair: Clinical Perspectives, Cellular Mechanisms and Promoting Regeneration of the Injured Brain and Spinal Cord.Biomedicines. 2024 Mar 13;12(3):643. doi: 10.3390/biomedicines12030643. Biomedicines. 2024. PMID: 38540256 Free PMC article. Review.
-
Acid sphingomyelinase as a pathological and therapeutic target in neurological disorders: focus on Alzheimer's disease.Exp Mol Med. 2024 Feb;56(2):301-310. doi: 10.1038/s12276-024-01176-4. Epub 2024 Feb 9. Exp Mol Med. 2024. PMID: 38337058 Free PMC article. Review.
-
Imipramine, an Acid Sphingomyelinase Inhibitor, Promotes Newborn Neuron Survival in the Hippocampus After Seizure.Cells. 2025 Feb 14;14(4):281. doi: 10.3390/cells14040281. Cells. 2025. PMID: 39996753 Free PMC article.
References
MeSH terms
Substances
Grants and funding
LinkOut - more resources
Full Text Sources
Medical
