ES-Screen: A Novel Electrostatics-Driven Method for Drug Discovery Virtual Screening
- PMID: 36499162
- PMCID: PMC9736079
- DOI: 10.3390/ijms232314830
ES-Screen: A Novel Electrostatics-Driven Method for Drug Discovery Virtual Screening
Abstract
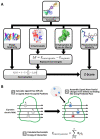
Electrostatic interactions drive biomolecular interactions and associations. Computational modeling of electrostatics in biomolecular systems, such as protein-ligand, protein-protein, and protein-DNA, has provided atomistic insights into the binding process. In drug discovery, finding biologically plausible ligand-protein target interactions is challenging as current virtual screening and adjuvant techniques such as docking methods do not provide optimal treatment of electrostatic interactions. This study describes a novel electrostatics-driven virtual screening method called 'ES-Screen' that performs well across diverse protein target systems. ES-Screen provides a unique treatment of electrostatic interaction energies independent of total electrostatic free energy, typically employed by current software. Importantly, ES-Screen uses initial ligand pose input obtained from a receptor-based pharmacophore, thus independent of molecular docking. ES-Screen integrates individual polar and nonpolar replacement energies, which are the energy costs of replacing the cognate ligand for a target with a query ligand from the screening. This uniquely optimizes thermodynamic stability in electrostatic and nonpolar interactions relative to an experimentally determined stable binding state. ES-Screen also integrates chemometrics through shape and other physicochemical properties to prioritize query ligands with the greatest physicochemical similarities to the cognate ligand. The applicability of ES-Screen is demonstrated with in vitro experiments by identifying novel targets for many drugs. The present version includes a combination of many other descriptor components that, in a future version, will be purely based on electrostatics. Therefore, ES-Screen is a first-in-class unique electrostatics-driven virtual screening method with a unique implementation of replacement electrostatic interaction energies with broad applicability in drug discovery.
Keywords: drug discovery; electrostatic energy; electrostatic potential; electrostatics; free energy; hit-to-lead identification; virtual screening.
Conflict of interest statement
The authors declare no conflict of interest.
Figures


Similar articles
-
Electrostatics in proteins and protein-ligand complexes.Future Med Chem. 2010 Apr;2(4):647-66. doi: 10.4155/fmc.10.6. Future Med Chem. 2010. PMID: 21426012 Review.
-
Electrostatic Energy in Protein-Ligand Complexes.Methods Mol Biol. 2019;2053:67-77. doi: 10.1007/978-1-4939-9752-7_5. Methods Mol Biol. 2019. PMID: 31452099
-
Implementation and evaluation of a docking-rescoring method using molecular footprint comparisons.J Comput Chem. 2011 Jul 30;32(10):2273-89. doi: 10.1002/jcc.21814. Epub 2011 May 3. J Comput Chem. 2011. PMID: 21541962 Free PMC article.
-
Negative Image-Based Rescoring: Using Cavity Information to Improve Docking Screening.Methods Mol Biol. 2021;2266:141-154. doi: 10.1007/978-1-0716-1209-5_8. Methods Mol Biol. 2021. PMID: 33759125
-
Protein electrostatics: a review of the equations and methods used to model electrostatic equations in biomolecules--applications in biotechnology.Biotechnol Annu Rev. 2003;9:315-95. doi: 10.1016/s1387-2656(03)09010-0. Biotechnol Annu Rev. 2003. PMID: 14650935 Review.
Cited by
-
Chemical, Biochemical, and Structural Similarities and Differences of Dermatological cAMP Phosphodiesterase-IV Inhibitors.J Invest Dermatol. 2025 Jun;145(6):1471-1488.e1. doi: 10.1016/j.jid.2024.10.597. Epub 2024 Nov 27. J Invest Dermatol. 2025. PMID: 39608668 Free PMC article.
References
-
- Sivanesan D., Basu G., Go N. The role of electrostatics in discrimination of adenine and guanine by proteins. Genome Inform. 2002;13:316–317.
MeSH terms
Substances
Grants and funding
LinkOut - more resources
Full Text Sources

