

Genome-Wide Identification of ATG Gene Family Members in Fagopyrum tataricum and Their Expression during Stress Responses
- PMID: 36499172
- PMCID: PMC9739578
- DOI: 10.3390/ijms232314845
Genome-Wide Identification of ATG Gene Family Members in Fagopyrum tataricum and Their Expression during Stress Responses
Abstract
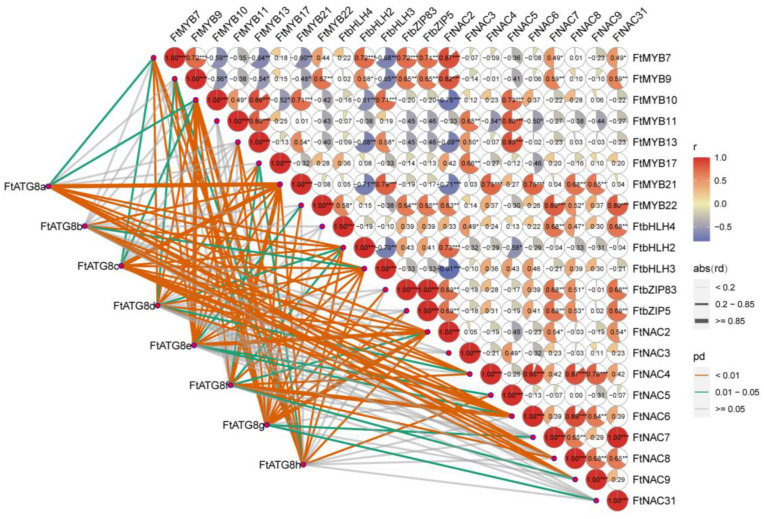
Abiotic stresses such as drought and salinity are major environmental factors limiting plant productivity. Autophagy-related genes are extensively involved in plant growth, development, and adverse stress responses, which have not yet been characterized in Tartary buckwheat (Fagopyrum tataricum, TB). In this study, we verified that drought stress could induce autophagy in TB roots. Next, 49 FtATGs in the whole genome of TB were identified. All FtATGs were randomly distributed in 8 known chromosomes, while 11 FtATGs were predictably segmental repeats. As the core component of autophagy, there were 8 FtATG8s with similar gene structures in TB, while FtATG8s showed high expression at the transcription level under drought and salt stresses. The cis-acting element analysis identified that all FtATG8 promoters contain light-responsive and MYB-binding elements. FtATG8s showed a cell-wide protein interaction network and strongly correlated with distinct stress-associated transcription factors. Furthermore, overexpression of FtATG8a and FtATG8f enhanced the antioxidant enzyme activities of TB under adverse stresses. Remarkably, FtATG8a and FtATG8f may be vital candidates functioning in stress resistance in TB. This study prominently aids in understanding the biological role of FtATG genes in TB.
Keywords: FtATG8s; Tartary buckwheat; abiotic stress; autophagy; functional validation.
Conflict of interest statement
The authors declare that they have no competing interests.
Figures


Similar articles
-
Genome-wide identification, abiotic stress, and expression analysis of PYL family in Tartary buckwheat (Fagopyrum tataricum (L.) Gaertn.) during grain development.BMC Plant Biol. 2024 Jul 30;24(1):725. doi: 10.1186/s12870-024-05447-0. BMC Plant Biol. 2024. PMID: 39080537 Free PMC article.
-
Genome-wide identification and expression analysis of the trihelix transcription factor family in tartary buckwheat (Fagopyrum tataricum).BMC Plant Biol. 2019 Aug 7;19(1):344. doi: 10.1186/s12870-019-1957-x. BMC Plant Biol. 2019. PMID: 31390980 Free PMC article.
-
Genome-wide identification of MAPK gene family members in Fagopyrum tataricum and their expression during development and stress responses.BMC Genomics. 2022 Feb 3;23(1):96. doi: 10.1186/s12864-022-08293-2. BMC Genomics. 2022. PMID: 35114949 Free PMC article.
-
Analysis of the MYB gene family in tartary buckwheat and functional investigation of FtPinG0005108900.01 in response to drought.BMC Plant Biol. 2025 Jan 7;25(1):25. doi: 10.1186/s12870-024-06019-y. BMC Plant Biol. 2025. PMID: 39773440 Free PMC article.
-
Genome-Wide Identification and Functional Analysis of the TIFY Family Genes in Response to Abiotic Stresses and Hormone Treatments in Tartary Buckwheat (Fagopyrum tataricum).Int J Mol Sci. 2023 Jun 30;24(13):10916. doi: 10.3390/ijms241310916. Int J Mol Sci. 2023. PMID: 37446090 Free PMC article.
Cited by
-
The Role of Plant Ubiquitin-like Modifiers in the Formation of Salt Stress Tolerance.Plants (Basel). 2024 May 25;13(11):1468. doi: 10.3390/plants13111468. Plants (Basel). 2024. PMID: 38891277 Free PMC article. Review.
-
Systematic analysis and expression of Gossypium ATG8 family reveals the roles of GhATG8f responding to salt stress in cotton.Plant Cell Rep. 2024 Feb 6;43(2):58. doi: 10.1007/s00299-023-03137-z. Plant Cell Rep. 2024. PMID: 38321189
-
Genome-wide characterization and expression analysis of MADS-box transcription factor gene family in Perilla frutescens.Front Plant Sci. 2024 Jan 8;14:1299902. doi: 10.3389/fpls.2023.1299902. eCollection 2023. Front Plant Sci. 2024. PMID: 38259943 Free PMC article.
References
MeSH terms
Substances
Grants and funding
LinkOut - more resources
Full Text Sources
Research Materials
