. 2022 Nov 28;23(23):14888.
doi: 10.3390/ijms232314888.

Integrative Proteomics and Transcriptomics Profiles of the Oviduct Reveal the Prolificacy-Related Candidate Biomarkers of Goats (Capra hircus) in Estrous Periods

Affiliations

Integrative Proteomics and Transcriptomics Profiles of the Oviduct Reveal the Prolificacy-Related Candidate Biomarkers of Goats (Capra hircus) in Estrous Periods

Zhipeng Sun et al. Int J Mol Sci. .

Abstract

The oviduct is a dynamic reproductive organ for mammalian reproduction and is required for gamete storage, maturation, fertilization, and early embryonic development, and it directly affects fecundity. However, the molecular regulation of prolificacy occurring in estrous periods remain poorly understood. This study aims to gain a better understanding of the genes involved in regulating goat fecundity in the proteome and transcriptome levels of the oviducts. Twenty female Yunshang black goats (between 2 and 3 years old, weight 52.22 ± 0.43 kg) were divided into high- and low-fecundity groups in the follicular (FH and FL, five individuals per group) and luteal (LH and LL, five individuals per group) phases, respectively. The DIA-based high-resolution mass spectrometry (MS) method was used to quantify proteins in twenty oviducts. A total of 5409 proteins were quantified, and Weighted gene co-expression network analysis (WGCNA) determined that the tan module was highly associated with the high-fecundity trait in the luteal phase, and identified NUP107, ANXA11, COX2, AKP13, and ITF140 as hub proteins. Subsequently, 98 and 167 differentially abundant proteins (DAPs) were identified in the FH vs. FL and LH vs. LL comparison groups, respectively. Parallel reaction monitoring (PRM) was used to validate the results of the proteomics data, and the hub proteins were analyzed with Western blot (WB). In addition, biological adhesion and transporter activity processes were associated with oviductal function, and several proteins that play roles in oviductal communication with gametes or embryos were identified, including CAMSAP3, ITGAM, SYVN1, EMG1, ND5, RING1, CBS, PES1, ELP3, SEC24C, SPP1, and HSPA8. Correlation analysis of proteomics and transcriptomic revealed that the DAPs and differentially expressed genes (DEGs) are commonly involved in the metabolic processes at the follicular phase; they may prepare the oviductal microenvironment for gamete reception; and the MAP kinase activity, estrogen receptor binding, and angiotensin receptor binding terms were enriched in the luteal phase, which may be actively involved in reproductive processes. By generating the proteome data of the oviduct at two critical phases and integrating transcriptome analysis, we uncovered novel aspects of oviductal gene regulation of fecundity and provided a reference for other mammals.

Keywords: DIA proteome; WGCNA; estrous period; fecundity; goat; oviduct; transcriptome.


Conflict of interest statement

The authors declare no conflict of interest.

Figures
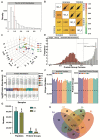
Figure 1
Figure 1
Overview of quality control (QC) and quantitative proteomics. (A) The coefficient of variation (CV) of QC distribution. (B) Correlation analysis of QC samples; the correlation coefficient close to 1 indicates that the system is more stable. (C) 3D Principal component analysis (PCA) of the quantified proteins for each QC sample. (D) Protein FDR analysis; the 1% Q Value is used as the qualitative threshold, which corresponds to FDR 0.01, red is the distribution of decoy (anti-library), gray is the target (positive library), C-score means the protein confidence score, and a higher C-score at 1% Q Value indicates a better result. (E) The quantitative intensity distribution of all samples and QC samples. (F) Statistics of the peptides and proteins identified in each sample; the dotted line represents the number of proteins or peptides at 50% of the total maximum number of identifications. (G) Comparison of peptides and proteins in data-dependent acquisition (DDA) and data-independent acquisition (DIA) strategies. (H) Venn diagram of proteins in different groups.
Figure 2
Figure 2
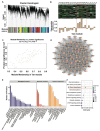
Protein co-expression network analysis of the oviduct proteome identified modules associated with high fecundity. (A) Module colors represent the final modules. Each branch in the hierarchical tree or each vertical line in the color bars represents one protein. (B) Eigengene expression pattern of the tan module. (C) A scatterplot of proteins significance for high fecundity in the luteal phase (LH) vs. module membership in the tan module. (D) The co-expressed protein network of the tan module. (E) GO analysis of Tan module proteins. The vertical coordinate indicates the GO Level 2 annotation information, including Biological Process, Molecular Function, and Cellular Component; the horizontal coordinate indicates the number of DAPs under each functional category. (F) KEGG enrichment analysis of Tan module proteins. Only the N-Glycan biosynthesis pathway was significantly enriched with a p value < 0.05.
Figure 3
Figure 3
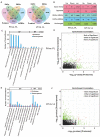
Differential abundant proteins (DAPs) screening and clustering analysis. Volcano plot of DAPs in the two comparison groups of FH vs. FL (A) and LH vs. LL (B). The X-axis represents the fold change in protein expression of different comparison groups. The Y axis represents the statistical significance of proteins. The blue dots represent the proteins that were not significantly downregulated, the red dots represent proteins that were significantly upregulated, and the gray dots represent proteins that were not significantly different. Cluster analysis of DAPs in the group of FH vs. FL (C) and LH vs. LL (D). The hierarchical clustering results are represented as a tree heat map, with the ordinate representing significantly differentially abundant proteins and the abscissa representing sample information. Red represents significantly upregulated proteins, blue represents significantly downregulated proteins, and gray represents no quantitative information for proteins.
Figure 4
Figure 4
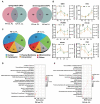
Functional annotation analysis of differentially abundant proteins (DAPs). (A) Venn diagram of DAPs identified between the follicular phase and luteal phase in the oviduct. (B) Validation results of six selected proteins in the four groups (FH, FL, LH, and LL) by parallel reaction monitoring (PRM). (C) Subcellular localization of DAPs in the different comparison groups. (D,E) Domain enrichment analysis of DAPs in the FH vs. FL (D) and LH vs. LL (E) comparison groups.
Figure 5
Figure 5
Gene ontology (GO) and Kyoto Encyclopedia of Genes and Genomes (KEGG) pathway enrichment analyses of differentially abundant proteins (DAPs) in the oviduct. GO annotation of DAPs in FH vs. FL (A) and LH vs. LL (B) comparison groups. KEGG classification of DAPs in FH vs. FL (C) and LH vs. LL (D) comparison groups. * Presents significant difference at p < 0.05.
Figure 6
Figure 6
Protein–protein interactions (PPI) network and Western blot analyses of hub DAPs. (A and B) PPI analysis of the DAPs was conducted based on the STRING database (https://www.string-db.org/, accessed on 10 May 2022) in FH vs. FL (A) and LH vs. LL (B) comparison groups; we selected a confidence score of >0.4 to construct the PPI network; Nodes represent proteins, edges denote the predicted functional associations. Box plots of proteins SYVN1, EMG1, HSPA8, and PES1 are shown. Western blot analysis of SYVN1 and EMG1 in the follicular phase (C,D), and HSPA8 and PES1 in the luteal phase (E,F), and the reference protein GAPDH. * Presents significant difference at p < 0.05, ** presents significant difference at p < 0.01.
Figure 7
Figure 7
Conserved and differential regulation of genes and proteins expression in the oviduct. (A) Venn diagram regarding the proteins and genes that were abundant in the follicular and luteal phases. (B) Comparison of abundance ratios from transcriptomic and proteomic profiling in the follicular and luteal phases; cor represents Pearson correlation coefficient. GO enrichment analysis of DEGs correlated with proteomic data in the follicular (C) and luteal phase (E). GO terms enriched in the group of proteins that were significantly changed at both the mRNA and protein levels or proteins that were significantly changed at the mRNA or protein level in the follicular (D) and luteal phases (F).
Figure 8
Figure 8
Protein and mRNA expression profiles of the protein candidates were validated by RT-qPCR in FH vs. FL (A) and LH vs. LL (C) comparison groups. Scatter plots show the correlation of gene expression between RNA-Seq and RT-qPCR in FH vs. FL (B) and LH vs. LL (D) comparison groups; Pearson correlation coefficient (R) and the p value is shown in the top left corner. * p < 0.05, ** p < 0.01, *** p < 0.001.

References

    1. Shah A.M., Cai Y.M., Zou H.W., Zhang X.F., Wang L.Z., Xue B., Yu P.Q., Wang Z.S., Peng Q.H. Effects of supplementation of branches and leaves trimmed from tea plant on growth performance, rumen fermentation and meat composition of Nanjiang yellow goats. Animals. 2019;9:590. doi: 10.3390/ani9090590. - DOI - PMC - PubMed
    1. Bridi A., Perecin F., da Silveira J.C. Extracellular vesicles mediated early embryo–maternal interactions. Int. J. Mol. Sci. 2022;21:1163. doi: 10.3390/ijms21031163. - DOI - PMC - PubMed
    1. Fazeli A. Maternal communication with gametes and embryos. Theriogenology. 2008;70:1182–1187. doi: 10.1016/j.theriogenology.2008.06.010. - DOI - PubMed
    1. Li S., Winuthayanon W. Oviduct: Roles in fertilization and early embryo development. J. Endocrinol. 2017;232:R1–R26. doi: 10.1530/JOE-16-0302. - DOI - PubMed
    1. Gao Y.W., Liu X.Y., Tang B., Li C., Kou Z.H., Li L., Liu W.Q., Wu Y., Kou X.C., Li J.Y., et al. Protein expression landscape of mouse embryos during pre-implantation development. Cell. Rep. 2017;21:3957–3969. doi: 10.1016/j.celrep.2017.11.111. - DOI - PubMed