. 2022 Dec 2;23(23):15194.
doi: 10.3390/ijms232315194.

Effect of Interactions between Phosphorus and Light Intensity on Metabolite Compositions in Tea Cultivar Longjing43

Affiliations

Effect of Interactions between Phosphorus and Light Intensity on Metabolite Compositions in Tea Cultivar Longjing43

Santosh Kc et al. Int J Mol Sci. .

Abstract

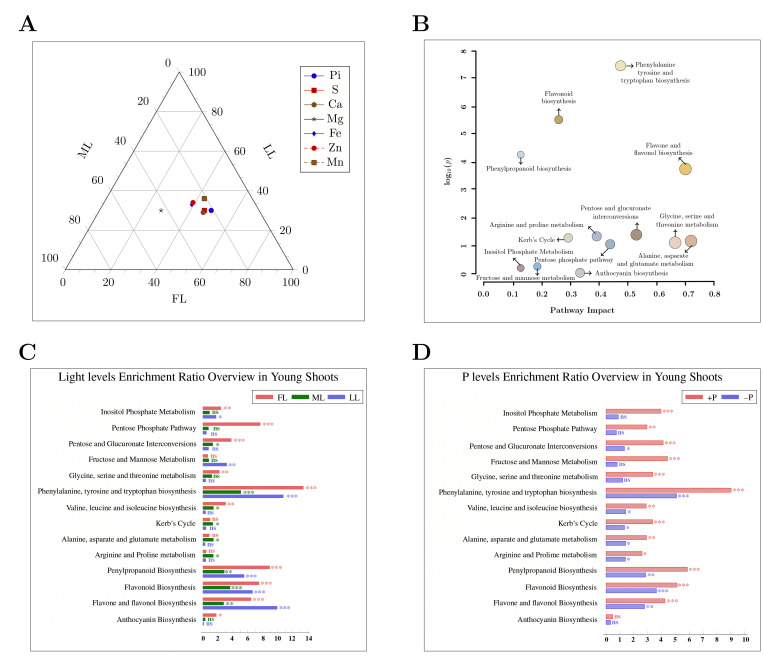
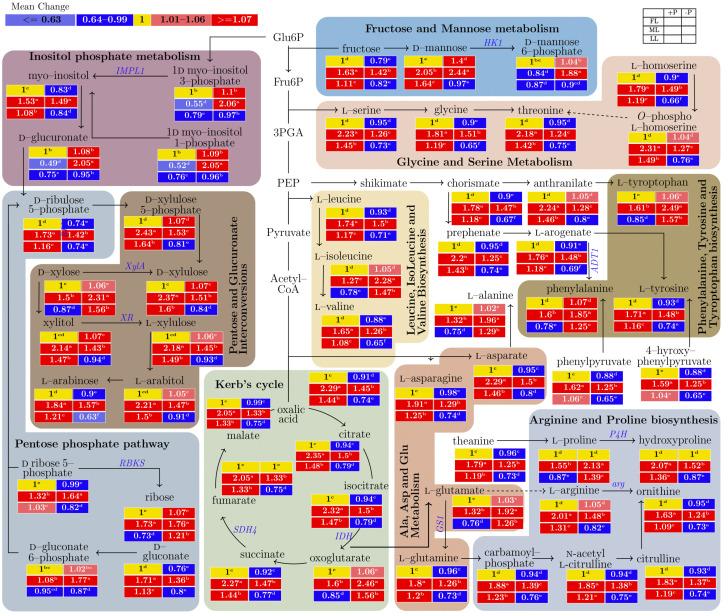
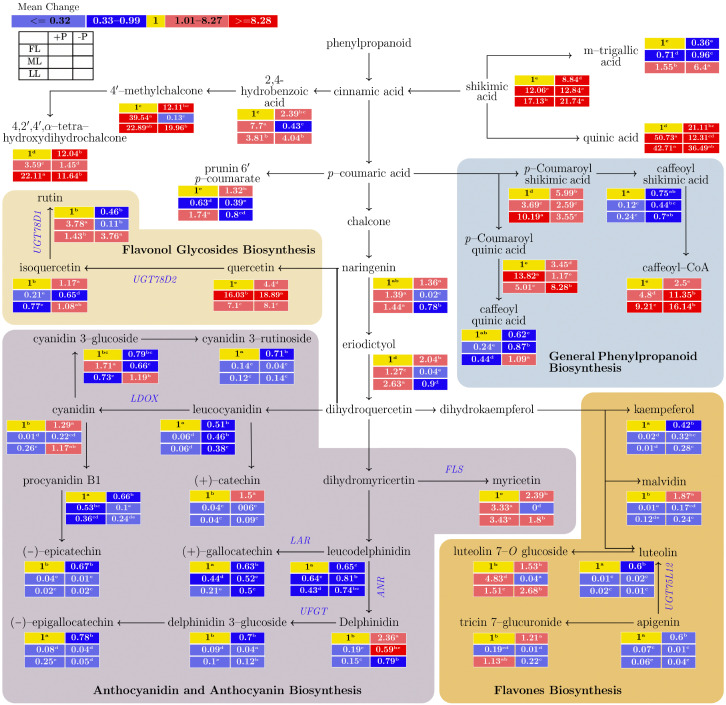
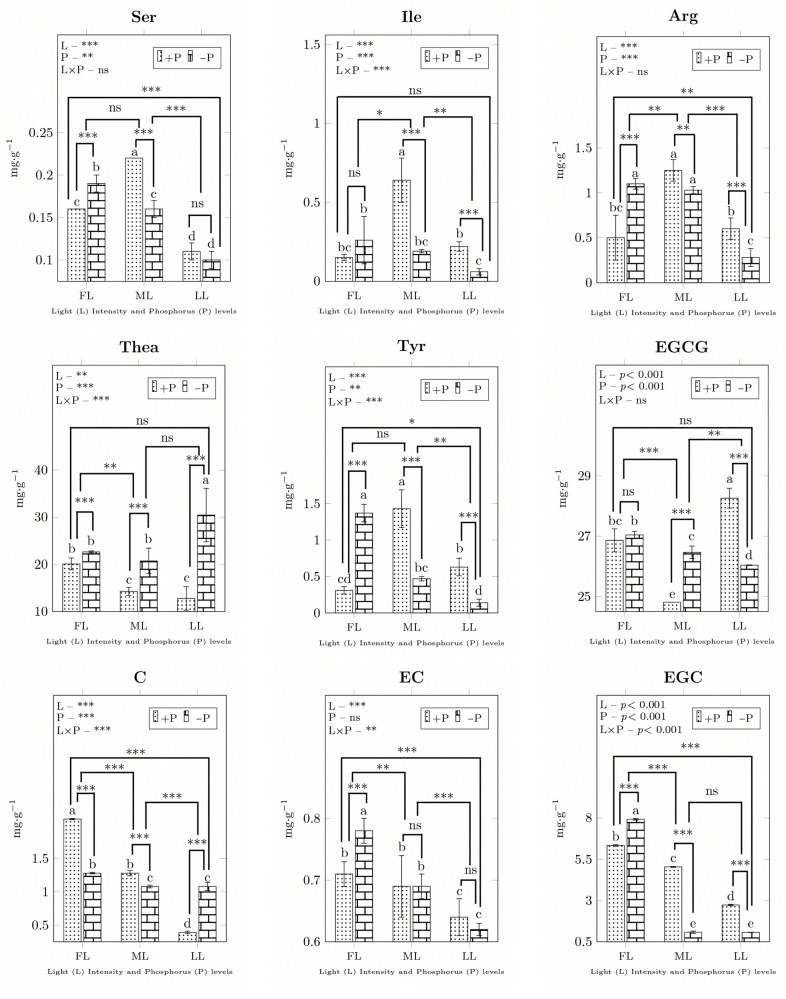
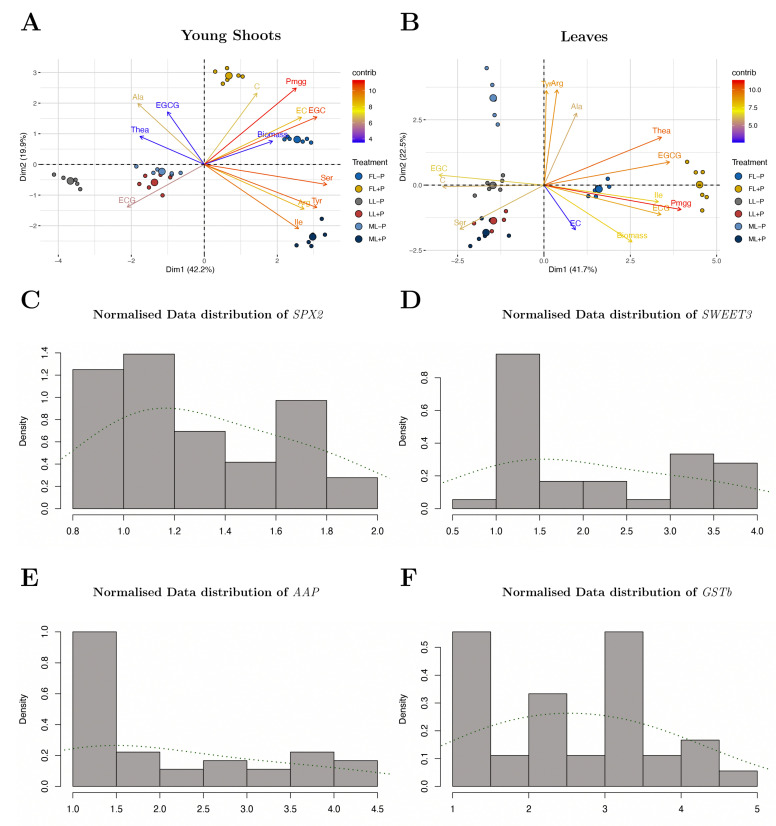
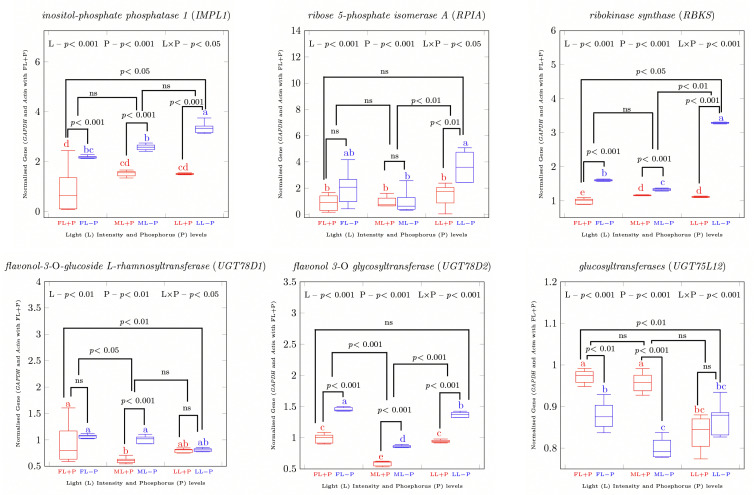
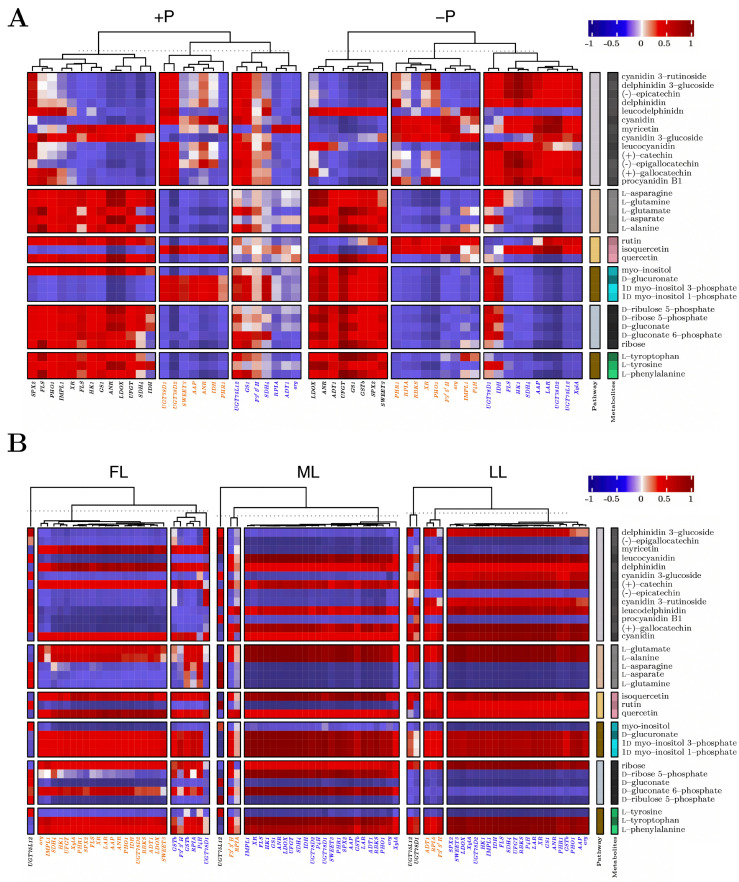
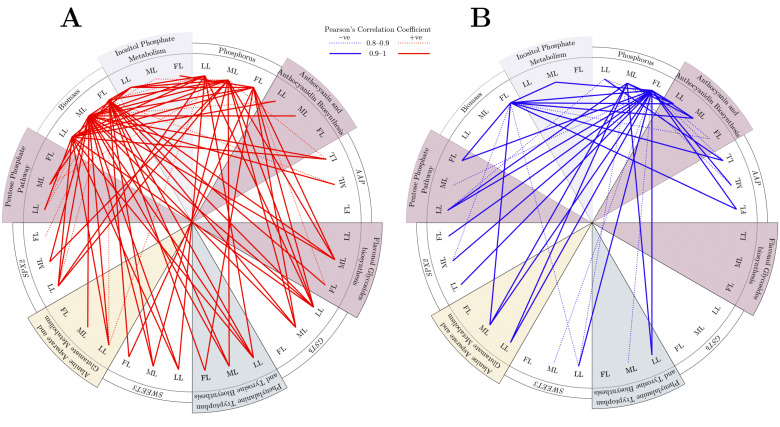
Light intensity influences energy production by increasing photosynthetic carbon, while phosphorus plays an important role in forming the complex nucleic acid structure for the regulation of protein synthesis. These two factors contribute to gene expression, metabolism, and plant growth regulation. In particular, shading is an effective agronomic practice and is widely used to improve the quality of green tea. Genotypic differences between tea cultivars have been observed as a metabolic response to phosphorus deficiency. However, little is known about how the phosphorus supply mediates the effect of shading on metabolites and how plant cultivar gene expression affects green tea quality. We elucidated the responses of the green tea cultivar Longjing43 under three light intensity levels and two levels of phosphorus supply based on a metabolomic analysis by GC×GC-TOF/MS (Two-dimensional Gas Chromatography coupled to Time-of-Flight Mass Spectrometry) and UPLC-Q-TOF/MS (Ultra-Performance Liquid Chromatography-Quadrupole-Time of Flight Mass Spectrometry), a targeted analysis by HPLC (High Performance Liquid Chromatography), and a gene expression analysis by qRT-PCR. In young shoots, the phosphorus concentration increased in line with the phosphate supply, and elevated light intensities were positively correlated with catechins, especially with epigallocatechin of Longjing43. Moreover, when the phosphorus concentration was sufficient, total amino acids in young shoots were enhanced by moderate shading which did not occur under phosphorus deprivation. By metabolomic analysis, phenylalanine, tyrosine, and tryptophan biosynthesis (PTT) were enriched due to light and phosphorus effects. Under shaded conditions, SPX2 (Pi transport, stress, sensing, and signaling), SWEET3 (bidirectional sugar transporter), AAP (amino acid permeases), and GSTb (glutathione S-transferase b) shared the same analogous correlations with primary and secondary metabolite pathways. Taken together, phosphorus status is a crucial factor when shading is applied to increase green tea quality.

Keywords: Camellia sinensis; green tea; light intensity; metabolome; phosphorus.


Conflict of interest statement

The authors declare no conflict of interest.

Figures

Figure 1
Figure 1
Overview of enriched pathways in young shoots of the Longjing43 cultivar. Ternary graph of plant nutrition (A) and pathway impact (B) under exposure to different light conditions with both P regimes. Overview of enriched pathways due to light conditions (C) and P levels (D) in young shoots. The circle with a pointed arrow shows the pathway impact under various light and P levels. Enrichment ratio bar graph asterisks indicate significant differences: *** = 0.001, ** = 0.01, * = 0.05, ns = non-significant differences. FL, full light intensity; ML, 50% of full light intensity; LL, 20% of full light intensity; +P, phosphorus-sufficient treatment; −P, phosphorus-deficient treatment.
Figure 2
Figure 2
Interactive effects of light and P on the primary metabolites in young shoots of the Longjing43 cultivar measured by two-dimensional Gas Chromatography coupled with Time-of-Flight Mass Spectrometry (GC×GC-TOF/MS). Each metabolite mean followed by a different letter in the heatmap table indicates a significant difference. In the heatmap, the red boxes represent values of >1 and are separated into dark red and light red by the mean values of the figured pathway data (>1). Values of <1 are presented in blue, and mean values are separated into light blue and dark blue based on the figured pathway data (<1). The yellow boxes represent the normalized values. The blank table in the legend shows the positions of the mean P and light treatment values for the metabolites. FL, full light intensity; ML, 50% of full light intensity; LL, 20% of full light intensity; +P, phosphorus-sufficient treatment; −P, phosphorus-deficient treatment.
Figure 3
Figure 3
The effect of the interaction of light and P on the biosynthesis of secondary metabolites in young shoots of the Longjing43 cultivar measured by Ultra-Performance Liquid Chromatography-Quadrupole-Time of Flight Mass Spectrometry (UPLC-Q-TOF/MS). The mean of each metabolite followed by a different letter in the heatmap table indicates a significant difference due to light and P treatments. In the heatmap, red boxes represent values of >1 and are separated into dark and red and light red by the mean values of the figured pathway data (>1). The yellow boxes represent the normalized values. The blank table in the legend shows the positions of the mean P and light treatment values of the metabolites. FL, full light intensity; ML, 50% of full light intensity; LL, 20% of full light intensity; +P, phosphorus-sufficient treatment; −P, phosphorus-deficient treatment.
Figure 4
Figure 4
The mean concentrations of amino acids (Ser, Ile, Arg, Thea and Tyr) and flavonoids (EGCG, C, EC and EGC) in young shoots of the Longjing43 cultivar. Different letters above columns indicating significant difference. *** = 0.001, ** = 0.01, * = 0.05, ns = non-significant differences, between light and P interaction. FL, full light intensity; ML, 50% of full light intensity; LL, 20% of full light intensity; +P, phosphorus-sufficient treatment; −P, phosphorus-deficient treatment.
Figure 5
Figure 5
A single biplot for the dataset combines both samples and treatments of (A) young shoots and (B) leaves with the principal components. Histogram of the normalized data distribution under different light and P regimes for (C) SPX2, (D)SWEET3, (E) AAP, and (F) GSTb in young shoots. FL, full light intensity; ML, 50% of full light intensity; LL, 20% of full light intensity; +P, phosphorus-sufficient treatment; −P, phosphorus-deficient treatment.
Figure 6
Figure 6
qRT-PCR was used to analyze the normalized primary and secondary metabolic gene transcripts (GAPDH and Actin) for the full light sample. Different letters above columns indicating significant difference and ns = non-significant differences between the light and P interaction. FL, full light intensity; ML, 50% of full light intensity; LL, 20% of full light intensity; +P, phosphorus-sufficient treatment; −P, phosphorus-deficient treatment.
Figure 7
Figure 7
Heatmap correlation between pathway metabolites and genes under different (A) P levels and (B) light regimes. FL, full light intensity; ML, 50% of full light intensity; LL, 20% of full light intensity; +P, phosphorus-sufficient treatment; −P, phosphorus-deficient treatment.
Figure 8
Figure 8
Circular representation of (A) positive and (B) negative correlations between pathways with phosphorus and biomass under different light regimes. FL, full light intensity; ML, 50% of full light intensity; LL, 20% of full light intensity; +P, phosphorus-sufficient treatment; −P, phosphorus-deficient treatment.

Similar articles

Cited by

References

    1. Jafari M., Tahmoures M., Ehteram M., Ghorbani M., Panahi F. Soil Erosion Control in Drylands. Springer; Berlin/Heidelberg, Germany: 2022. Agroforestry and Its Role in Soil Erosion Biological Control; pp. 649–700.
    1. Ji H.-G., Lee Y.-R., Lee M.-S., Hwang K.H., Park C.Y., Kim E.-H., Park J.S., Hong Y.-S. Diverse metabolite variations in tea (Camellia sinensis L.) leaves grown under various shade conditions revisited: A metabolomics study. J. Agric. Food Chem. 2018;66:1889–1897. doi: 10.1021/acs.jafc.7b04768. - DOI - PubMed
    1. Zhao S., Cheng H., Xu P., Wang Y. Regulation of biosynthesis of the main flavor-contributing metabolites in tea plant (Camellia sinensis): A review. Crit. Rev. Food Sci. Nutr. 2022. in press . - PubMed
    1. Kc S., Long L., Liu M., Zhang Q., Ruan J. Light Intensity Modulates the Effect of Phosphate Limitation on Carbohydrates, Amino Acids, and Catechins in Tea Plants (Camellia sinensis L.) Front. Plant Sci. 2021;12:743781. doi: 10.3389/fpls.2021.743781. - DOI - PMC - PubMed
    1. Lynch J.H., Dudareva N. Aromatic amino acids: A complex network ripe for future exploration. Trends Plant Sci. 2020;25:670–681. doi: 10.1016/j.tplants.2020.02.005. - DOI - PubMed