

Age-Related Decline in Nrf2/ARE Signaling Is Associated with the Mitochondrial DNA Damage and Cognitive Impairments
- PMID: 36499517
- PMCID: PMC9739464
- DOI: 10.3390/ijms232315197
Age-Related Decline in Nrf2/ARE Signaling Is Associated with the Mitochondrial DNA Damage and Cognitive Impairments
Abstract
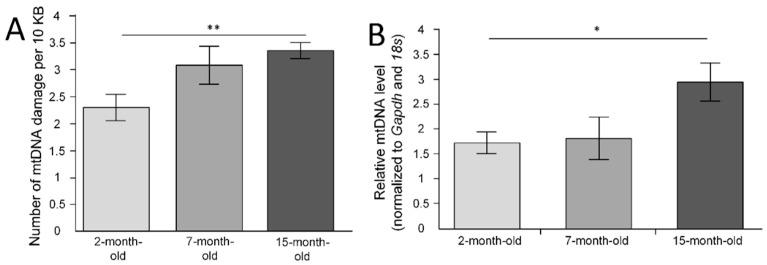
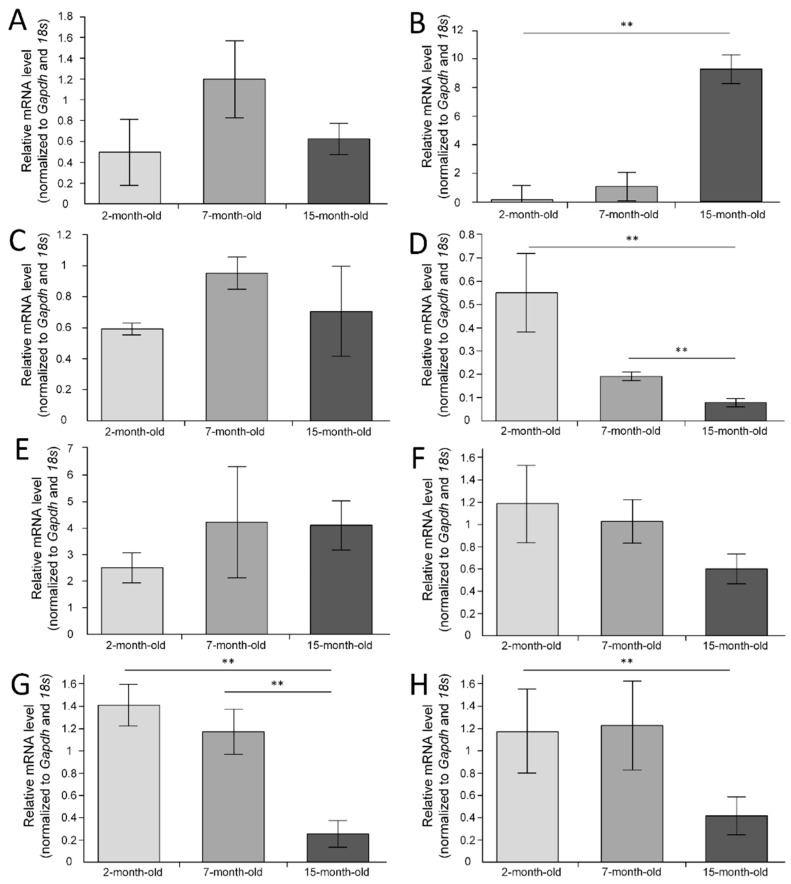
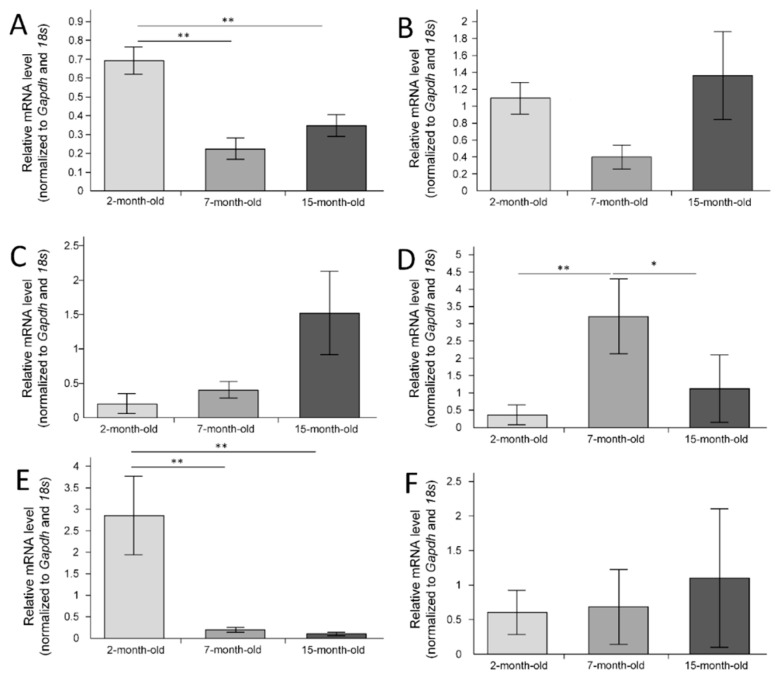
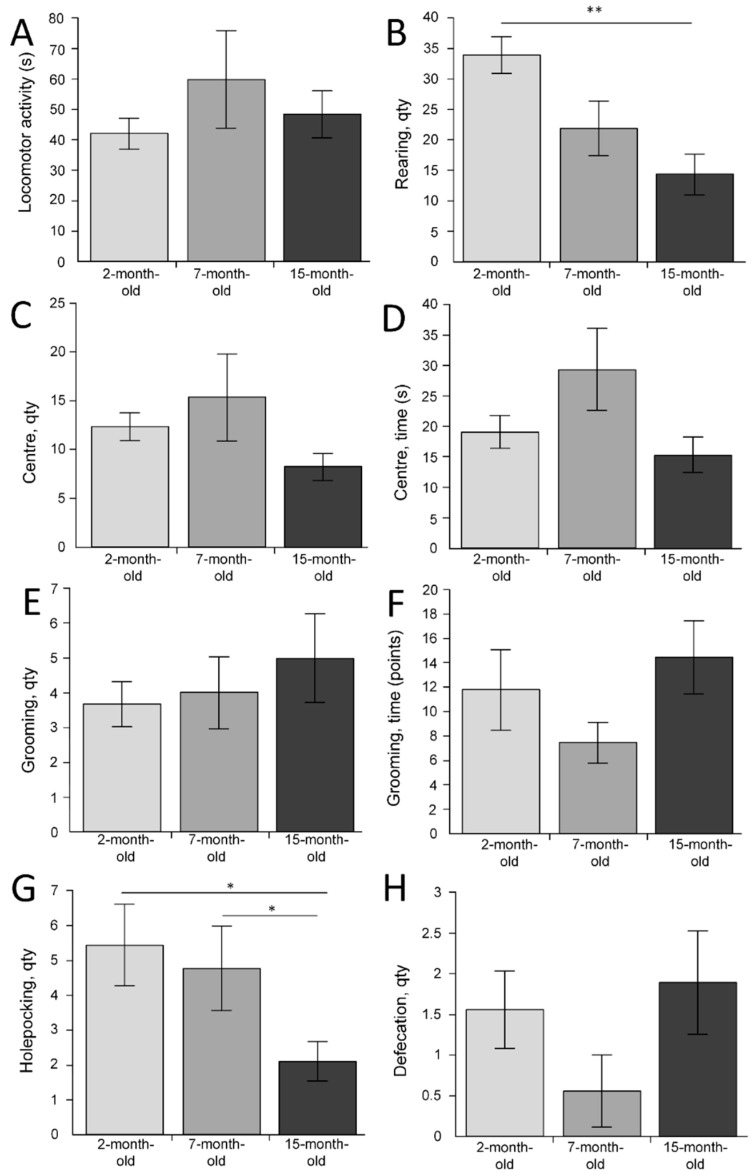
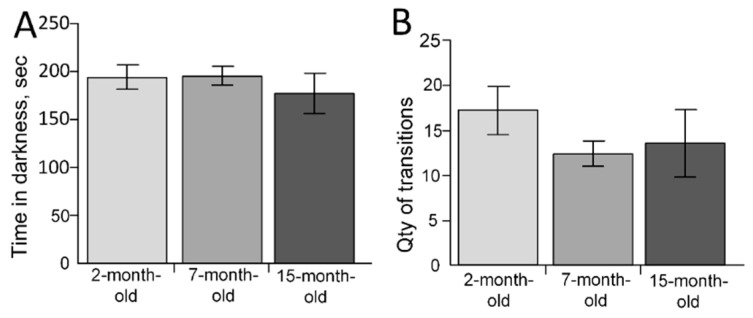
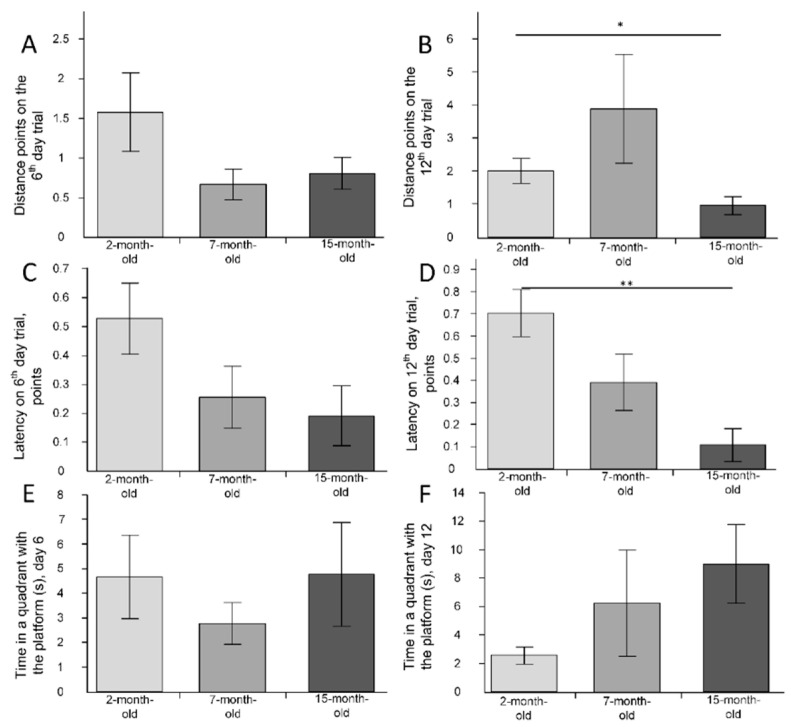
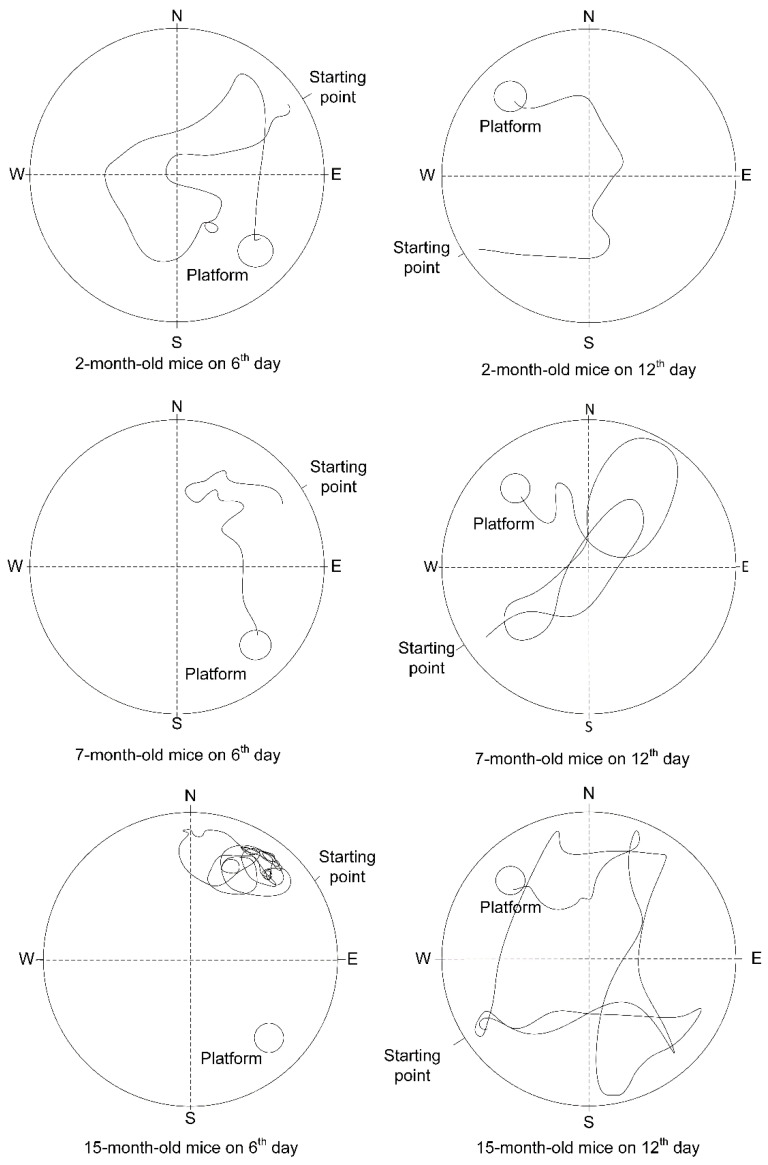
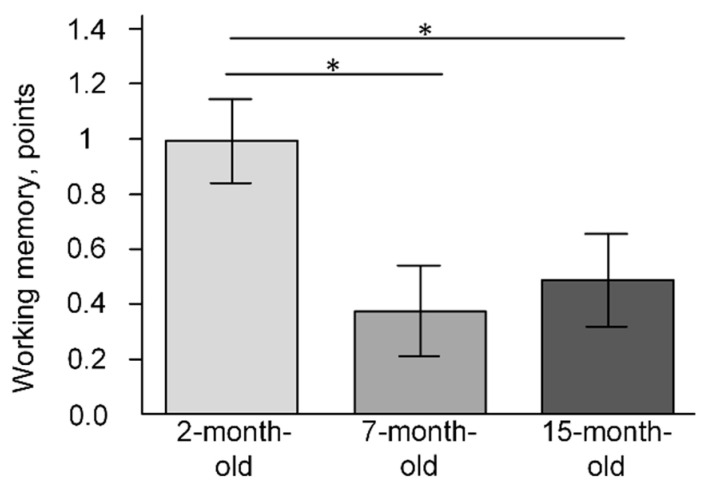
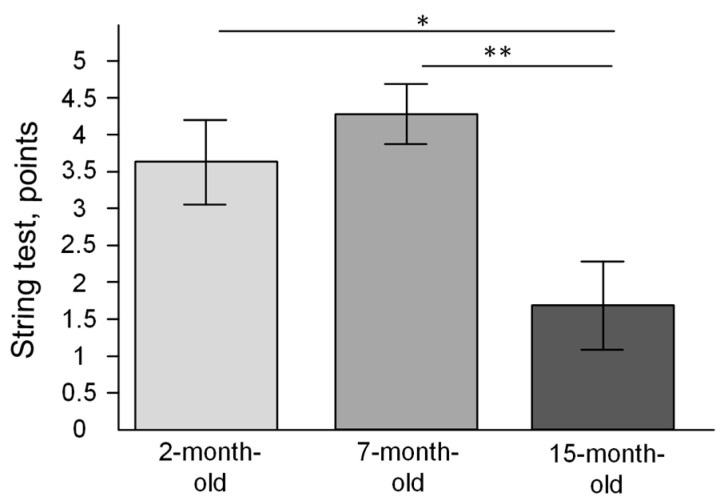
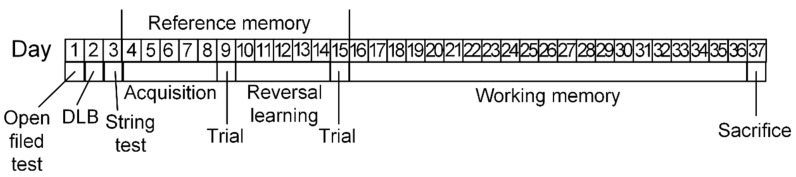
In this research, we compared the cognitive parameters of 2-, 7-, and 15-month-old mice, changes in mitochondrial DNA (mtDNA) integrity and expression of genes involved in the nuclear erythroid 2-related factor 2/antioxidant response element (Nrf2/ARE) signaling pathway. We showed an age-related decrease in the Nfe2l2 expression in the cerebral cortex, not in the hippocampus. At the same time, we find an increase in the mtDNA copy number in the cerebral cortex, despite the lack of an increase in gene expression, which is involved in the mitochondrial biogenesis regulation. We suppose that increase in mtDNA content is associated with mitophagy downregulation. We supposed that mitophagy downregulation may be associated with an age-related increase in the mtDNA damage. In the hippocampus, we found a decrease in the Bdnf expression, which is involved in the pathways, which play an essential role in regulating long-term memory formation. We showed a deficit of working and reference memory in 15-month-old-mice in the water Morris maze, and a decrease in the exploratory behavior in the open field test. Cognitive impairments in 15-month-old mice correlated with a decrease in Bdnf expression in the hippocampus, Nfe2l2 expression, and an increase in the number of mtDNA damage in the cerebral cortex. Thus, these signaling pathways may be perspective targets for pharmacological intervention to maintain mitochondrial quality control, neuronal plasticity, and prevent the development of age-related cognitive impairment.
Keywords: Morris water maze; aging; brain-derived neurotrophic factor; cognitive deficit; mammalian target of rapamycin complex 1; mitochondrial DNA damage; nuclear erythroid 2-related factor 2.
Conflict of interest statement
The authors declare no conflict of interest.
Figures
Similar articles
-
BDNF pathway is involved in the protective effects of SS-31 on isoflurane-induced cognitive deficits in aging mice.Behav Brain Res. 2016 May 15;305:115-21. doi: 10.1016/j.bbr.2016.02.036. Epub 2016 Mar 2. Behav Brain Res. 2016. PMID: 26944333
-
Beta-Hydroxybutyrate Mitigates Sensorimotor and Cognitive Impairments in a Photothrombosis-Induced Ischemic Stroke in Mice.Int J Mol Sci. 2024 May 24;25(11):5710. doi: 10.3390/ijms25115710. Int J Mol Sci. 2024. PMID: 38891898 Free PMC article.
-
Assessment of Nuclear and Mitochondrial DNA, Expression of Mitochondria-Related Genes in Different Brain Regions in Rats after Whole-Body X-ray Irradiation.Int J Mol Sci. 2020 Feb 11;21(4):1196. doi: 10.3390/ijms21041196. Int J Mol Sci. 2020. PMID: 32054039 Free PMC article.
-
Role of the Nrf2/ARE Pathway in the mtDNA Reparation.Front Biosci (Landmark Ed). 2024 Jun 18;29(6):218. doi: 10.31083/j.fbl2906218. Front Biosci (Landmark Ed). 2024. PMID: 38940042 Review.
-
[Pathways for maintenance of mitochondrial DNA integrity and mitochondrial functions in cells exposed to ionizing radiation].Radiats Biol Radioecol. 2013 Mar-Apr;53(2):117-36. doi: 10.7868/s0869803113020045. Radiats Biol Radioecol. 2013. PMID: 23786028 Review. Russian.
Cited by
-
The onset and the development of cardiometabolic aging: an insight into the underlying mechanisms.Front Pharmacol. 2024 Sep 26;15:1447890. doi: 10.3389/fphar.2024.1447890. eCollection 2024. Front Pharmacol. 2024. PMID: 39391689 Free PMC article. Review.
-
Mitochondrial Bioenergetics, Redox Balance, and Calcium Homeostasis Dysfunction with Defective Ultrastructure and Quality Control in the Hippocampus of Aged Female C57BL/6J Mice.Int J Mol Sci. 2023 Mar 13;24(6):5476. doi: 10.3390/ijms24065476. Int J Mol Sci. 2023. PMID: 36982549 Free PMC article.
-
Effect of Inducers and Inhibitors of the Keap1/Nrf2/ARE System on the Viability and Functional Activity of Model Neuronal-Like and Glial Cells.Bull Exp Biol Med. 2024 Jan;176(3):332-337. doi: 10.1007/s10517-024-06019-w. Epub 2024 Feb 10. Bull Exp Biol Med. 2024. PMID: 38340195
-
Mitochondrial Dysfunction in Parkinson's Disease: A Contribution to Cognitive Impairment?Int J Mol Sci. 2024 Oct 25;25(21):11490. doi: 10.3390/ijms252111490. Int J Mol Sci. 2024. PMID: 39519043 Free PMC article. Review.
-
Proteostasis Decline and Redox Imbalance in Age-Related Diseases: The Therapeutic Potential of NRF2.Biomolecules. 2025 Jan 13;15(1):113. doi: 10.3390/biom15010113. Biomolecules. 2025. PMID: 39858508 Free PMC article. Review.
References
MeSH terms
Substances
Grants and funding
LinkOut - more resources
Full Text Sources
