. 2022 Dec 2;23(23):15208.
doi: 10.3390/ijms232315208.

Plasma Neurofilament Light Chain (NF-L) Is a Prognostic Biomarker for Cortical Damage Evolution but Not for Cognitive Impairment or Epileptogenesis Following Experimental TBI

Affiliations

Plasma Neurofilament Light Chain (NF-L) Is a Prognostic Biomarker for Cortical Damage Evolution but Not for Cognitive Impairment or Epileptogenesis Following Experimental TBI

Mette Heiskanen et al. Int J Mol Sci. .

Abstract

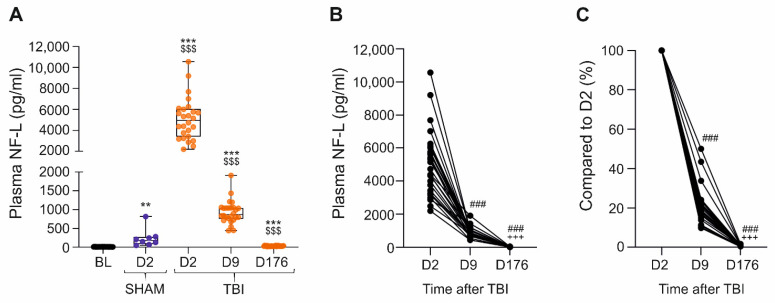
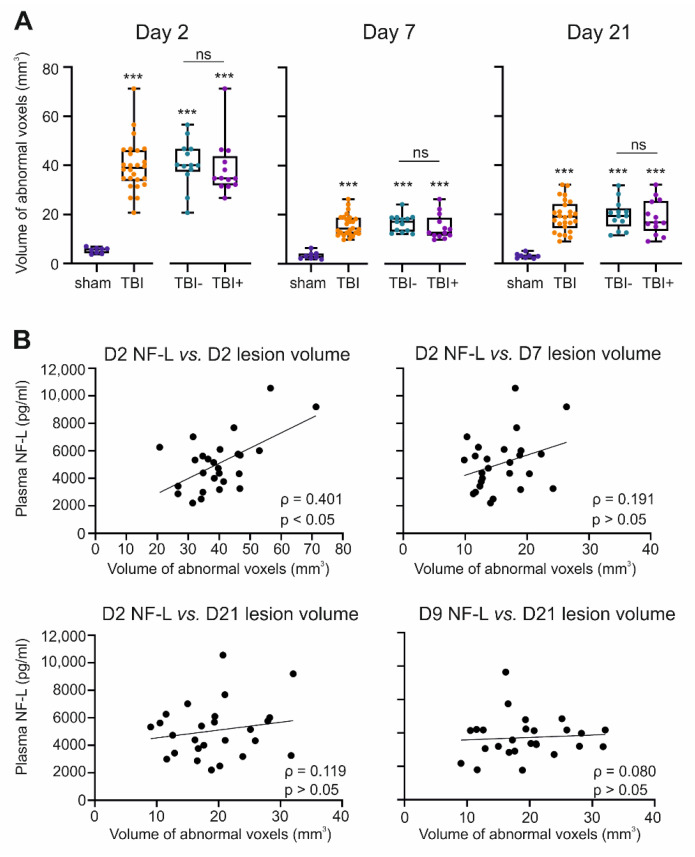
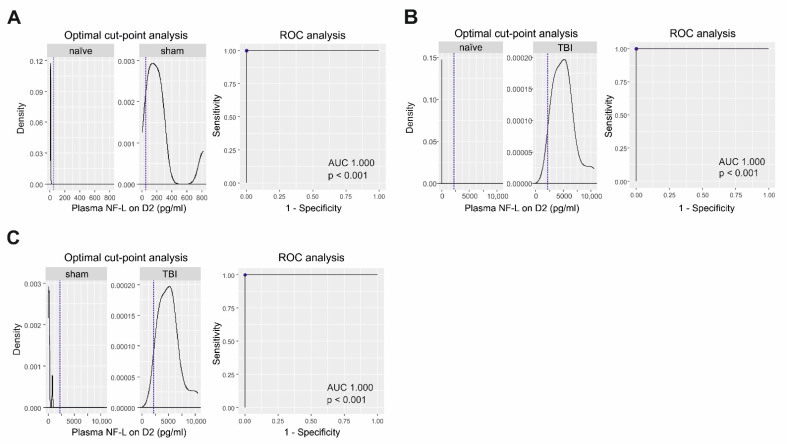
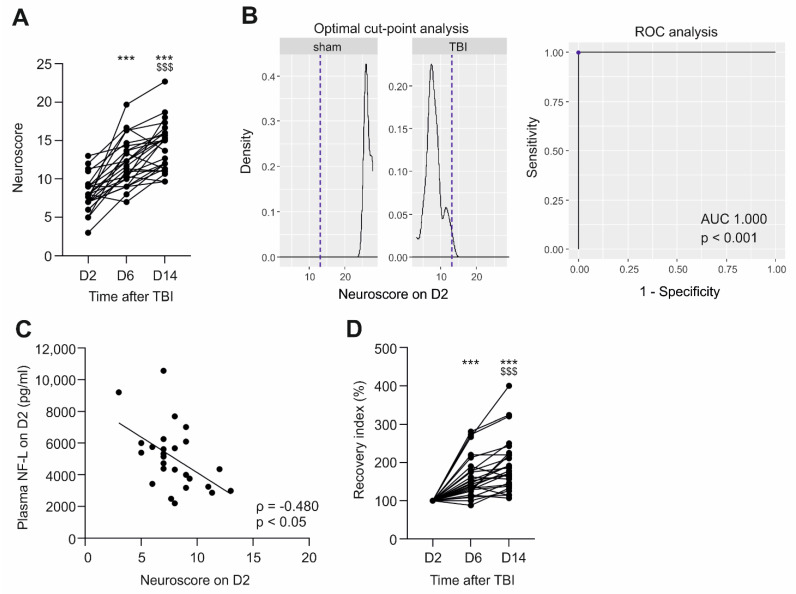
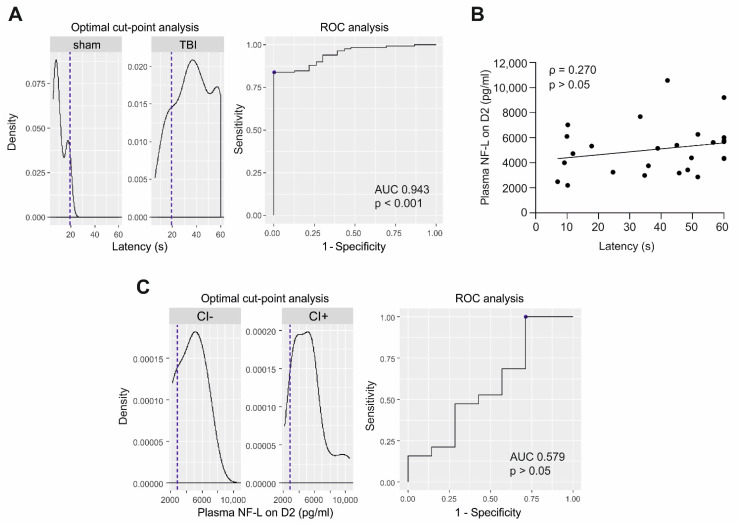
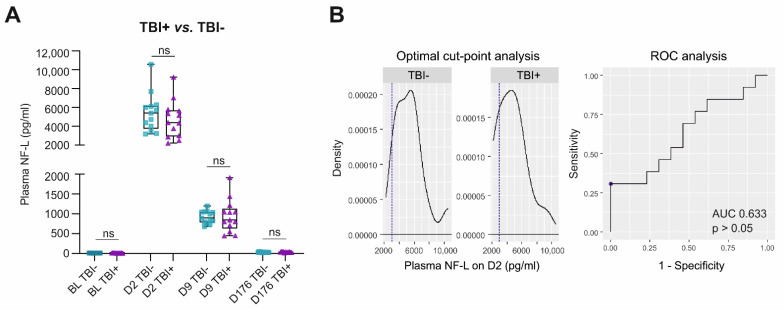
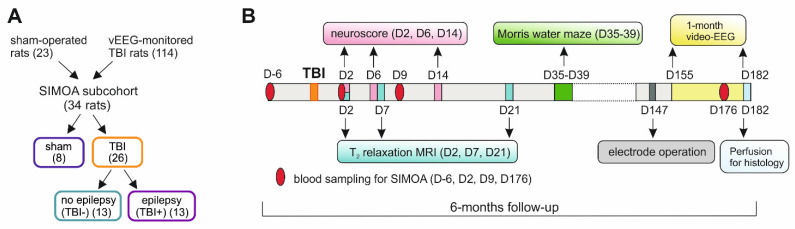
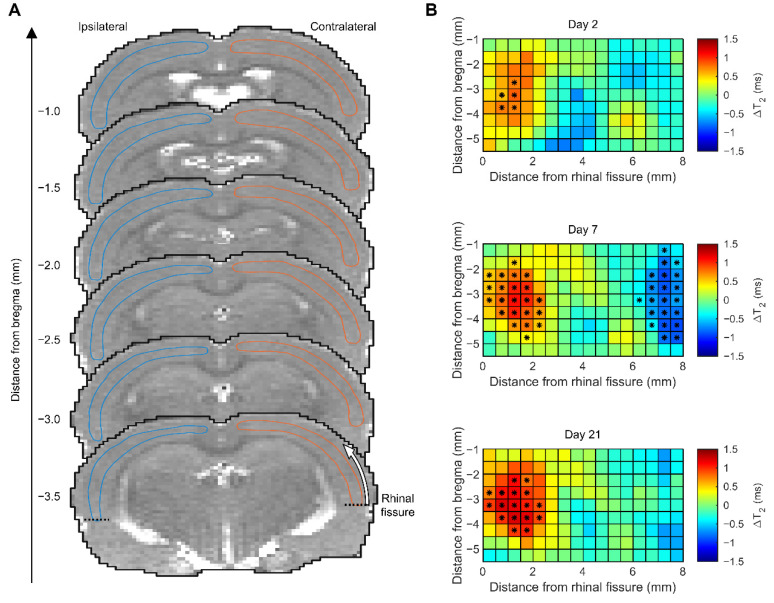
Plasma neurofilament light chain (NF-L) levels were assessed as a diagnostic biomarker for traumatic brain injury (TBI) and as a prognostic biomarker for somatomotor recovery, cognitive decline, and epileptogenesis. Rats with severe TBI induced by lateral fluid-percussion injury (n = 26, 13 with and 13 without epilepsy) or sham-operation (n = 8) were studied. During a 6-month follow-up, rats underwent magnetic resonance imaging (MRI) (day (D) 2, D7, and D21), composite neuroscore (D2, D6, and D14), Morris-water maze (D35−D39), and a 1-month-long video-electroencephalogram to detect unprovoked seizures during the 6th month. Plasma NF-L levels were assessed using a single-molecule assay at baseline (i.e., naïve animals) and on D2, D9, and D178 after TBI or a sham operation. Plasma NF-L levels were 483-fold higher on D2 (5072.0 ± 2007.0 pg/mL), 89-fold higher on D9 (930.3 ± 306.4 pg/mL), and 3-fold higher on D176 32.2 ± 8.9 pg/mL after TBI compared with baseline (10.5 ± 2.6 pg/mL; all p < 0.001). Plasma NF-L levels distinguished TBI rats from naïve animals at all time-points examined (area under the curve [AUC] 1.0, p < 0.001), and from sham-operated controls on D2 (AUC 1.0, p < 0.001). Plasma NF-L increases on D2 were associated with somatomotor impairment severity (ρ = −0.480, p < 0.05) and the cortical lesion extent in MRI (ρ = 0.401, p < 0.05). Plasma NF-L increases on D2 or D9 were associated with the cortical lesion extent in histologic sections at 6 months post-injury (ρ = 0.437 for D2; ρ = 0.393 for D9, p < 0.05). Plasma NF-L levels, however, did not predict somatomotor recovery, cognitive decline, or epileptogenesis (p > 0.05). Plasma NF-L levels represent a promising noninvasive translational diagnostic biomarker for acute TBI and a prognostic biomarker for post-injury somatomotor impairment and long-term structural brain damage.

Keywords: ROC analysis; fluid-percussion injury; post-traumatic epilepsy; rat; single molecule array (SIMOA).


Conflict of interest statement

The authors declare no conflict of interest.

Figures

Figure 1
Figure 1
Plasma NF-L concentrations at different time-points after a sham operation or TBI. (A) Box and whisker plots (whiskers: minimum and maximum; box: interquartile range; line: median) showing plasma NF-L levels (y-axis) in different groups (x-axis). Samples collected at baseline (n = 34) before any operation (BL on D-6) were considered comparable to naïve samples. In the sham group (n = 8, blue), plasma NF-L levels were analyzed on D2 post-operation only. In the TBI group (n = 26, orange), plasma NF-L levels were assessed on D2, D9, and D176 after TBI. Each dot represents 1 animal. Note the slightly elevated plasma NF-L levels in the sham-operated animals on D2 compared with their baseline values (** p < 0.01, Wilcoxon). In the TBI group, the NF-L levels were elevated on all testing days as compared to their baseline values [Friedman test (p < 0.001) followed by post hoc analysis with Wilcoxon: ***, p < 0.001]. On D2 and D9, the average NF-L levels were higher in the TBI group than in the sham group ($$$, p < 0.001, Mann-Whitney U test). (B) Dynamics of NF-L concentrations in individual TBI animals over time [Friedman test (p < 0.001) followed by post hoc analysis with Wilcoxon: ###, p < 0.001 compared with D2; +++, p < 0.001 compared with D9]. (C) Change in plasma NF-L levels as a percentage over time (D2 marked as 100%) [Friedman test (p < 0.001) followed by post hoc analysis with Wilcoxon: ###, p < 0.001 compared with D2; +++, p < 0.001 compared with D9]. Abbreviations: BL, baseline; D2, day 2 after TBI; D9, day 9; D176, day 176 (6 months); NF-L, neurofilament light chain; TBI, traumatic brain injury.
Figure 2
Figure 2
Plasma NF-L and cortical lesion severity in quantitative T2 magnetic resonance imaging (MRI). (A) Box and whisker plots (whiskers: minimum and maximum; box: interquartile range; line: median) showing the total volume of abnormal pixels (cortical T2 signal, y-axis) in rat brain MRI on D2, D7, and D21 after TBI (n = 26) or sham operation (n = 8). The TBI group included 13 rats without epilepsy (TBI−) and 13 rats with epilepsy (TBI+). Each dot represents 1 animal. (B) Spearman correlation between the plasma levels of NF-L (y-axis) and volume of abnormal T2 area (x-axis) in MRI (TBI group only) on D2, D7, and D21. Note that on D2, the higher the NF-L level, the greater the volume of the abnormal T2 area. No correlations were detected at later time-points. Statistical significance: ***, p < 0.001 as compared with the sham group (Mann-Whitney U test). Abbreviations: D2, day 2 after TBI; D9, day 9; D21, day 21; NF-L, neurofilament light chain; ns, not significant; TBI, traumatic brain injury.
Figure 3
Figure 3
Plasma NF-L as a diagnostic biomarker for sham operation and TBI. (A) ROC analysis indicated that NF-L levels on D2 distinguished sham-operated rats (n = 8) from the naïve condition (baseline samples, n = 34) with 100% sensitivity and 100% specificity (AUC 1.0, p < 0.001, cut-off 49 pg/mL (dashed line)]. (B) NF-L levels on D2 distinguished TBI rats (n = 26) from the naïve condition (n = 34) with 100% sensitivity and 100% specificity (AUC 1.0, p < 0.001, cut-off: 2201 pg/mL). (C) NF-L levels on D2 distinguished TBI (n = 13) and sham-operated rats (n = 13) with 100% sensitivity and 100% specificity (AUC 1.0, p < 0.001, cut-off: 2201 pg/mL). Abbreviations: AUC, area under the curve; BL, baseline; D2, day 2 post-TBI, NF-L, neurofilament light chain; ROC, receiver operating characteristics; TBI, traumatic brain injury.
Figure 4
Figure 4
Plasma NF-L and somatomotor performance after TBI. (A) Evolution of the neuroscore in each TBI rat (n = 26) over the 14-day follow-up (D2, D6, and D14) after TBI. Note that in the sham-group, the average neuroscore was 26.5 on D2, 27.4 on D6, and 27.5 on D14. (B) The optimal cut-off and ROC analysis indicated that the D2 neuroscore differentiated TBI (n = 26) and sham-operated rats (n = 8) with 100% sensitivity and 100% specificity [AUC 1.0, p < 0.001, cut-off 13.0 (dashed line)]. (C) Spearman’s correlation revealed that the higher the plasma NF-L levels on D2, the lower the neuroscore on D2 post-TBI (ρ = −0.480, p < 0.05). (D) Improvement of the neuroscore (recovery index) for each TBI rat (n = 26), compared with the neuroscore on D2. Statistical significances: ***, p < 0.001 compared to D2; $$$, p < 0.001 compared to D6 (Wilcoxon matched pairs signed rank test). Abbreviations: AUC, area under the curve; D2, day 2 post-TBI; D6, day 6, D14, day 14; NF-L, neurofilament light chain; ROC, receiver operating characteristics; TBI, traumatic brain injury.
Figure 5
Figure 5
Plasma NF-L and cognitive impairment after TBI. (A) Optimal cut-point analysis was performed in the EPITARGET animal cohort to identify parameters that differentiate cognitively impaired (CI+) and non-impaired (CI−) rats. The cut-point latency of 19.2 s (i.e., latency to reach the platform in the Morris water maze (MWM) on the 3rd day of testing, i.e., on D37, dashed line) differentiated TBI (n = 118) and sham-operated rats (n = 23) with AUC 0.94 (p < 0.001) and was set as a limit for cognitive impairment. (B) No correlation was detected between plasma NF-L levels on D2 and MWM latency on D37 (Spearman correlation rho (ρ) = 0.270, p > 0.05, n = 26). (C) Accordingly, ROC analysis indicated that plasma NF-L levels did not distinguish CI+ (latency > 19.2 s) from CI− (<19.2 s) rats (AUC 0.58, p > 0.05, Mann-Whitney U test). Abbreviations: AUC, area under the curve; D2, day 2 post-TBI; ROC, receiver operating characteristics; TBI, traumatic brain injury.
Figure 6
Figure 6
Plasma NF-L and epileptogenesis after TBI. (A) Box and whisker plots (whiskers: minimum and maximum; box: interquartile range; line: median) showing plasma NF-L levels (y-axis) in different groups and time-points (x-axis). Plasma NF-L levels on D2, D9, or D176 did not differ between rats that did (TBI+, n = 13) or did not develop epilepsy (TBI−, n = 13, p > 0.05). (B) Plasma NF-L levels on D2, D9, or D176 did not distinguish TBI+ and TBI− rats in the ROC analysis (p > 0.05, results for D2 shown in the figure). Statistical significance: ns, not significant (Mann-Whitney U test). Abbreviations: AUC, area under the curve; BL, baseline; D2, day 2 post-TBI; D9, day 9; D176, day 176; NF-L, neurofilament light chain; ROC, receiver operating characteristics.
Figure 7
Figure 7
Study design. (A) The first 34 rats [8 sham-operated experimental controls, and 26 with traumatic brain injury (TBI)] completing the 6-month follow-up in the EPITARGET animal cohort of 137 animals (23 sham, and 114 TBI) were included in the present analysis [22,37]. Within the TBI group, 13 rats exhibited no unprovoked seizures in video-encephalogram (vEEG) (TBI−). In 13 rats, we found at least 1 unprovoked seizure during the 6th month vEEG (TBI+). The number of animals was based on a power calculation. That is, we expected the plasma NF-L to separate the TBI− and TBI+ groups with AUC 0.800 (MedCalc software). (B) Timing of the tests included in the present analysis (for a complete study design, see [22]). During the 6-month follow-up, rats underwent blood sampling via the tail vein, behavioral tests (neuroscore and Morris water maze), in vivo quantitative T2 magnetic resonance imaging (MRI), and 1-month continuous vEEG monitoring. Plasma levels of neurofilament light chain were assessed using a single molecule array (SIMOA). Abbreviations: D, day.
Figure 8
Figure 8
Cortical T2 magnetic resonance imaging (MRI) analysis in the sham-operated experimental control group. (A) T2 images of the sham animals were registered to a template brain. Then, the ipsilateral (left, blue outline) and the contralateral (right, orange outline) cortex was manually outlined in each image slice (thickness 0.5 mm). In each slice, a cortical profile of the T2 relaxation time was measured, starting at the rhinal fissure and continuing dorsally towards the brain midline as indicated by the white arrow (bottom slice). (B) The cortical T2 profiles of different slices were combined, filtered using a 2-dimensional isotropic Gaussian filter with a standard deviation of 0.5 mm, and interpolated on a grid with a 0.5 × 0.5 mm2 resolution. We found an ipsilateral signal increase on D2, D7, and D21 in areas close to the rhinal fissure at the rostrocaudal level (-3.5 mm from the bregma) as the median of the ipsilateral T2 area was increased compared with that contralaterally. We also found a parasagittal signal decrease on D7. Color coding of the heatmap: red indicates a positive ipsilateral vs. contralateral difference in T2 (higher T2 ipsilaterally), and blue indicates a negative difference (higher T2 contralaterally). An asterisk (*) at a given grid point indicates a statistically significant difference for the median T2 (Mann-Whitney U-test, after correcting for multiple comparisons using the Benjamini-Hochberg procedure with an average false discovery rate of 0.05).

Similar articles

Cited by

References

    1. Dewan M.C., Rattani A., Gupta S., Baticulon R.E., Hung Y.C., Punchak M., Agrawal A., Adeleye A.O., Shrime M.G., Rubiano A.M., et al. Estimating the Global Incidence of Traumatic Brain Injury. J. Neurosurg. 2019;130:1080–1097. doi: 10.3171/2017.10.JNS17352. - DOI - PubMed
    1. Pitkänen A., Paananen T., Kyyriäinen J., Das Gupta S., Heiskanen M., Vuokila N., Bañuelos-Cabrera I., Lapinlampi N., Kajevu N., Andrade P., et al. Biomarkers for Posttraumatic Epilepsy. Epilepsy Behav. 2021;121:107080. doi: 10.1016/j.yebeh.2020.107080. - DOI - PubMed
    1. Mozaffari K., Dejam D., Duong C., Ding K., French A., Ng E., Preet K., Franks A., Kwan I., Phillips H.W., et al. Systematic Review of Serum Biomarkers in Traumatic Brain Injury. Cureus. 2021;13:e17056. doi: 10.7759/cureus.17056. - DOI - PMC - PubMed
    1. Krausz A.D., Korley F.K., Burns M.A. The Current State of Traumatic Brain Injury Biomarker Measurement Methods. Biosensors. 2021;11:319. doi: 10.3390/bios11090319. - DOI - PMC - PubMed
    1. Smith D.H., Kochanek P.M., Rosi S., Meyer R., Ferland-Beckham C., Prager E.M., Ahlers S.T., Crawford F. Roadmap for Advancing Pre-Clinical Science in Traumatic Brain Injury. J. Neurotrauma. 2021;38:3204–3221. doi: 10.1089/neu.2021.0094. - DOI - PMC - PubMed

MeSH terms