

Detection of SARS-CoV-2 Virus by Triplex Enhanced Nucleic Acid Detection Assay (TENADA)
- PMID: 36499587
- PMCID: PMC9740288
- DOI: 10.3390/ijms232315258
Detection of SARS-CoV-2 Virus by Triplex Enhanced Nucleic Acid Detection Assay (TENADA)
Abstract
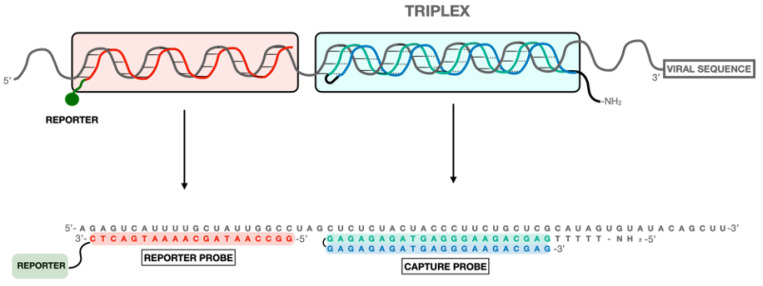
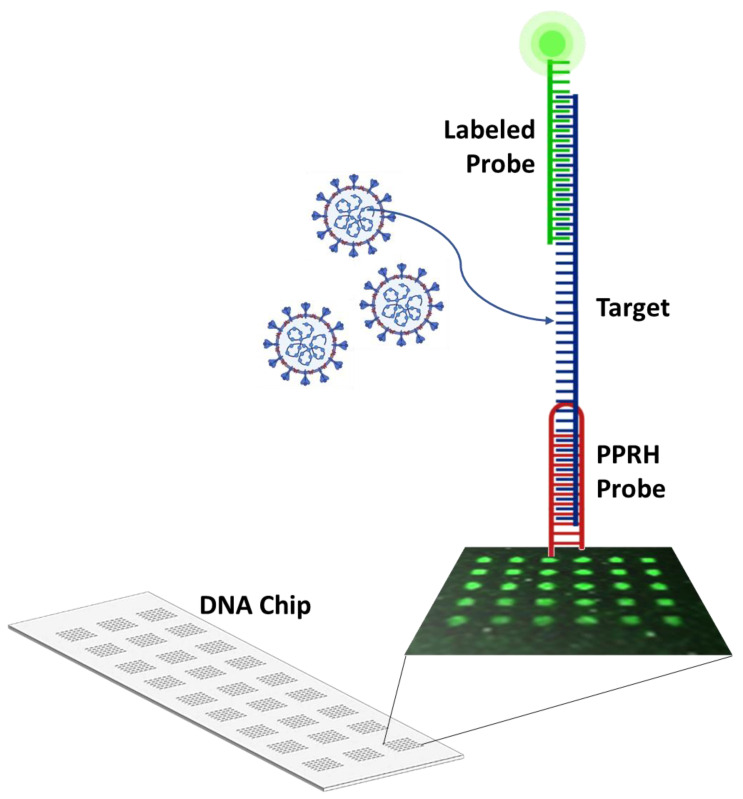
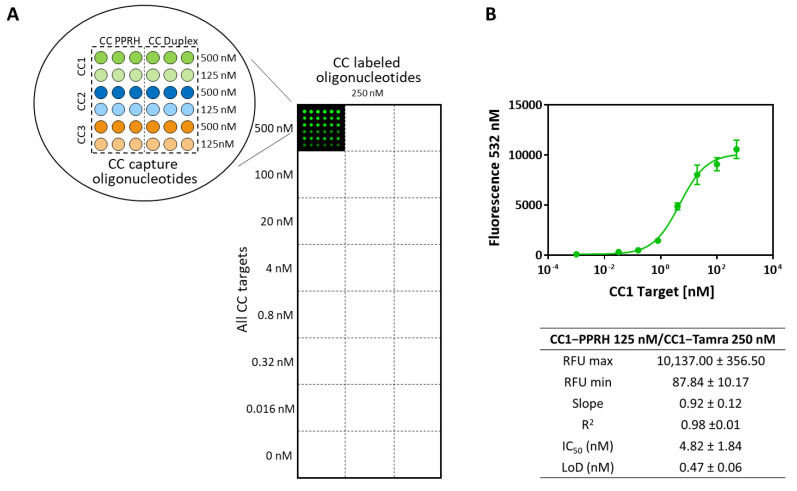
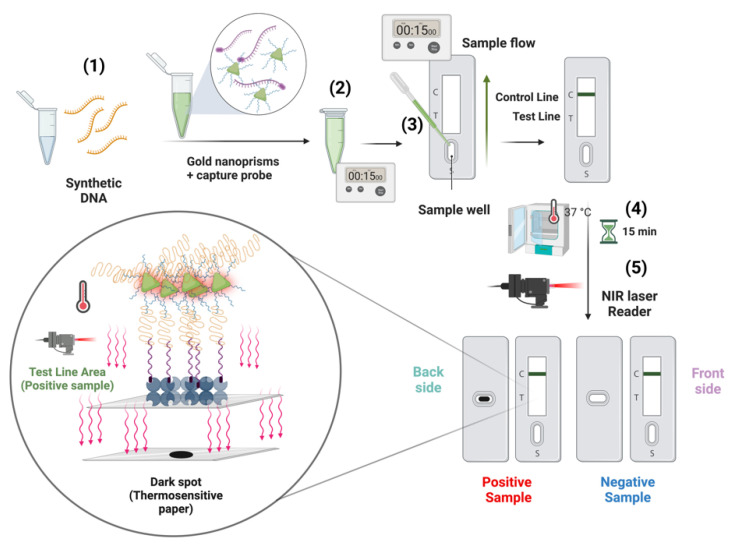
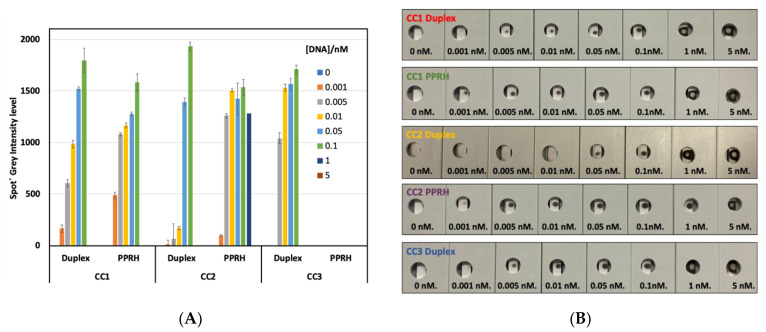
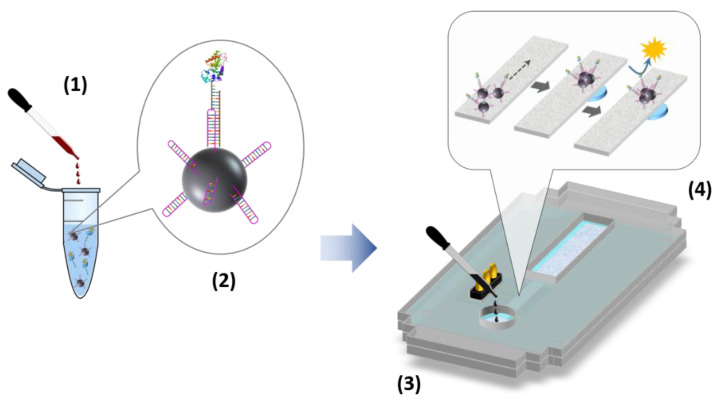
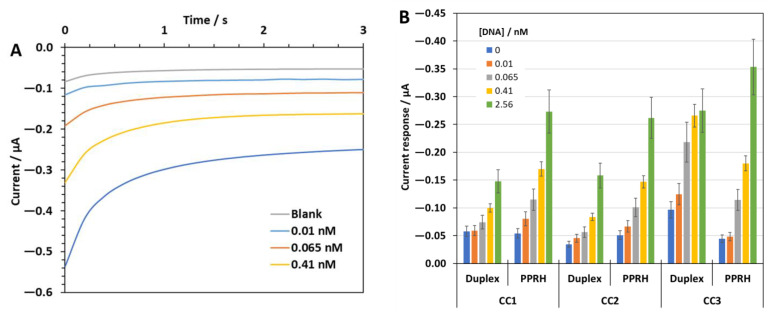
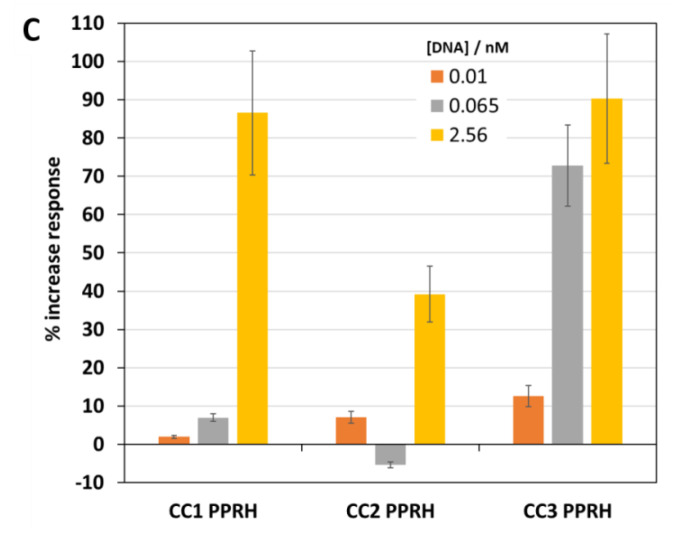
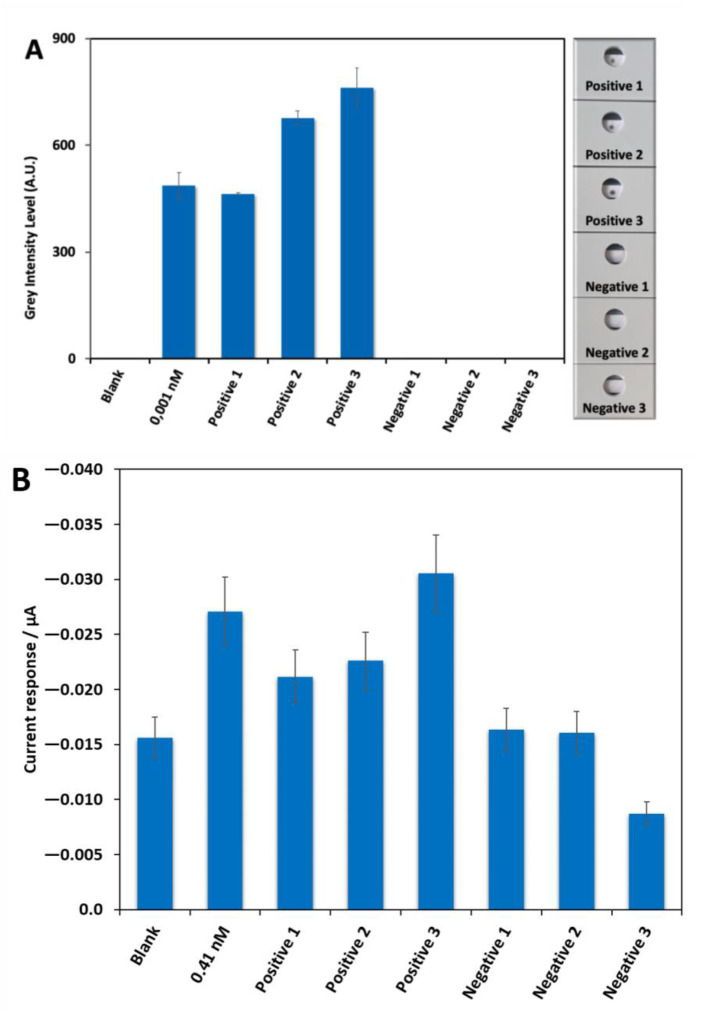
SARS-CoV-2, a positive-strand RNA virus has caused devastating effects. The standard method for COVID diagnosis is based on polymerase chain reaction (PCR). The method needs expensive reagents and equipment and well-trained personnel and takes a few hours to be completed. The search for faster solutions has led to the development of immunological assays based on antibodies that recognize the viral proteins that are faster and do not require any special equipment. Here, we explore an innovative analytical approach based on the sandwich oligonucleotide hybridization which can be adapted to several biosensing devices including thermal lateral flow and electrochemical devices, as well as fluorescent microarrays. Polypurine reverse-Hoogsteen hairpins (PPRHs) oligonucleotides that form high-affinity triplexes with the polypyrimidine target sequences are used for the efficient capture of the viral genome. Then, a second labeled oligonucleotide is used to detect the formation of a trimolecular complex in a similar way to antigen tests. The reached limit of detection is around 0.01 nM (a few femtomoles) without the use of any amplification steps. The triplex enhanced nucleic acid detection assay (TENADA) can be readily adapted for the detection of any pathogen requiring only the knowledge of the pathogen genome sequence.
Keywords: COVID diagnosis; Polypurine reverse-Hoogsteen hairpin; SARS-CoV-2 RNA detection; electrochemical magnetoassay; fluorescent microarray; thermal lateral flow.
Conflict of interest statement
The authors declare no conflict of interest.
Figures
Similar articles
-
Modified Bis-pyrimidine Clamps for Triplex Formation and Their Use in SARS-CoV‑2 Detection.ACS Omega. 2025 May 23;10(22):23535-23548. doi: 10.1021/acsomega.5c02155. eCollection 2025 Jun 10. ACS Omega. 2025. PMID: 40521503 Free PMC article.
-
Sensitive fluorescent detection of SARS-CoV-2 RNA using an enzymatic-based method.Spectrochim Acta A Mol Biomol Spectrosc. 2025 Apr 15;331:125766. doi: 10.1016/j.saa.2025.125766. Epub 2025 Jan 23. Spectrochim Acta A Mol Biomol Spectrosc. 2025. PMID: 39879958
-
Isothermal recombinase polymerase amplification-lateral flow detection of SARS-CoV-2, the etiological agent of COVID-19.J Virol Methods. 2021 Oct;296:114227. doi: 10.1016/j.jviromet.2021.114227. Epub 2021 Jul 2. J Virol Methods. 2021. PMID: 34224752 Free PMC article.
-
Biosensing strategies for the detection of SARS-CoV-2 nucleic acids.J Pharm Biomed Anal. 2023 Aug 5;232:115370. doi: 10.1016/j.jpba.2023.115370. Epub 2023 Mar 29. J Pharm Biomed Anal. 2023. PMID: 37163830 Free PMC article. Review.
-
Recent advances in methods for the diagnosis of Corona Virus Disease 2019.J Clin Lab Anal. 2022 Jan;36(1):e24178. doi: 10.1002/jcla.24178. Epub 2021 Dec 17. J Clin Lab Anal. 2022. PMID: 34921443 Free PMC article. Review.
Cited by
-
Targeting MYC Regulation with Polypurine Reverse Hoogsteen Oligonucleotides.Int J Mol Sci. 2022 Dec 26;24(1):378. doi: 10.3390/ijms24010378. Int J Mol Sci. 2022. PMID: 36613820 Free PMC article.
-
Modified Bis-pyrimidine Clamps for Triplex Formation and Their Use in SARS-CoV‑2 Detection.ACS Omega. 2025 May 23;10(22):23535-23548. doi: 10.1021/acsomega.5c02155. eCollection 2025 Jun 10. ACS Omega. 2025. PMID: 40521503 Free PMC article.
-
Polypurine reverse hoogsteen hairpins as a therapeutic tool for SARS-CoV-2 infection.J Biol Chem. 2024 Nov;300(11):107884. doi: 10.1016/j.jbc.2024.107884. Epub 2024 Oct 11. J Biol Chem. 2024. PMID: 39395809 Free PMC article.
-
Unraveling the Amplification-Free Quantitative Detection of Viral RNA in Nasopharyngeal Swab Samples Using a Compact Electrochemical Rapid Test Device.Anal Chem. 2025 Jun 10;97(22):11863-11873. doi: 10.1021/acs.analchem.5c01605. Epub 2025 May 30. Anal Chem. 2025. PMID: 40443387 Free PMC article.
-
Chemistry and Biology of Noncanonical Nucleic Acid Structures: From Physicochemical Properties to Therapeutic Applications.Int J Mol Sci. 2024 May 1;25(9):4952. doi: 10.3390/ijms25094952. Int J Mol Sci. 2024. PMID: 38732170 Free PMC article.
References
-
- Dao Thi V.L., Herbst K., Boerner K., Meurer M., Kremer L.P.M., Kirrmaier D., Freistaedter A., Papagiannidis D., Galmozzi C., Stanifer M.L. A colorimetric RT-LAMP assay and LAMP-sequencing for detecting SARS-CoV-2 RNA in clinical samples. Sci. Transl. Med. 2020;12:eabc7075. doi: 10.1126/scitranslmed.abc7075. - DOI - PMC - PubMed
MeSH terms
Substances
Grants and funding
LinkOut - more resources
Full Text Sources
Other Literature Sources
Medical
Miscellaneous
