

Mangiferin Ameliorates Obesity-Associated Inflammation and Autophagy in High-Fat-Diet-Fed Mice: In Silico and In Vivo Approaches
- PMID: 36499655
- PMCID: PMC9735994
- DOI: 10.3390/ijms232315329
Mangiferin Ameliorates Obesity-Associated Inflammation and Autophagy in High-Fat-Diet-Fed Mice: In Silico and In Vivo Approaches
Abstract
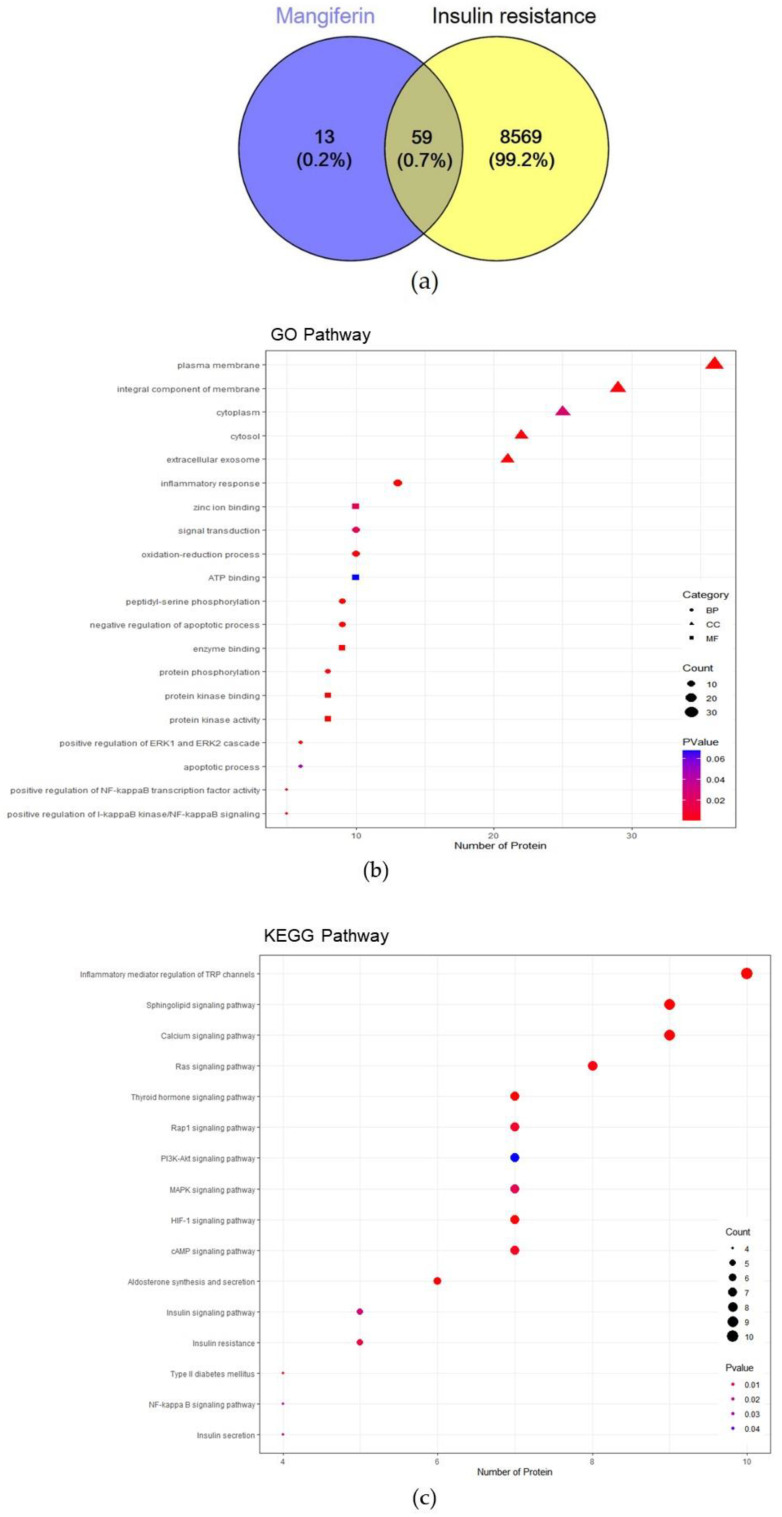
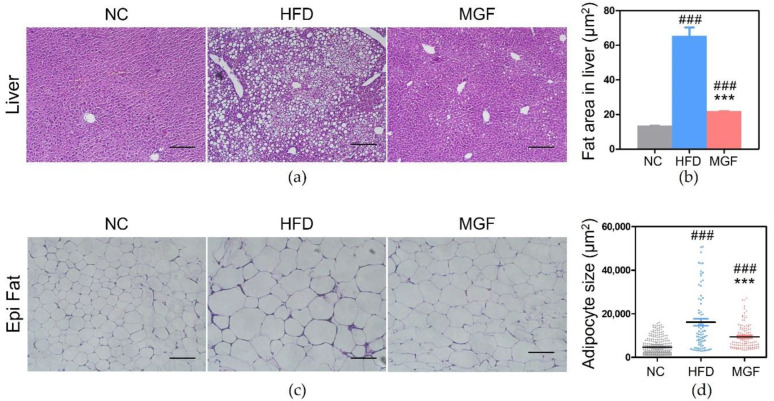
Obesity-induced insulin resistance is the fundamental cause of metabolic syndrome. Accordingly, we evaluated the effect of mangiferin (MGF) on obesity and glucose metabolism focusing on inflammatory response and autophagy. First, an in silico study was conducted to analyze the mechanism of MGF in insulin resistance. Second, an in vivo experiment was conducted by administering MGF to C57BL/6 mice with high-fat-diet (HFD)-induced metabolic disorders. The in silico analysis revealed that MGF showed a high binding affinity with macrophage-related inflammatory cytokines and autophagy proteins. In the in vivo study, mice were divided into three groups: normal chow, HFD, and HFD + MGF 150 mg/kg. MGF administration to obese mice significantly improved the body weight, insulin-sensitive organs weights, glucose and lipid metabolism, fat accumulation in the liver, and adipocyte size compared to HFD alone. MGF significantly reduced the macrophages in adipose tissue and Kupffer cells, inhibited the gene expression ratio of tumor necrosis factor-α and F4/80 in adipose tissue, reduced the necrosis factor kappa B gene, and elevated autophagy-related gene 7 and fibroblast growth factor 21 gene expressions in the liver. Thus, MGF exerted a therapeutic effect on metabolic diseases by improving glucose and lipid metabolism through inhibition of the macrophage-mediated inflammatory responses and activation of autophagy.
Keywords: Anemarrhenae rhizoma; autophagy; inflammation; insulin resistance; mangiferin; obesity.
Conflict of interest statement
The authors declare no conflict of interest.
Figures


Similar articles
-
The Effects of Poncirus fructus on Insulin Resistance and the Macrophage-Mediated Inflammatory Response in High Fat Diet-Induced Obese Mice.Int J Mol Sci. 2019 Jun 12;20(12):2858. doi: 10.3390/ijms20122858. Int J Mol Sci. 2019. PMID: 31212747 Free PMC article.
-
Depletion of Kupffer cells attenuates systemic insulin resistance, inflammation and improves liver autophagy in high-fat diet fed mice.Endocr J. 2015;62(7):615-26. doi: 10.1507/endocrj.EJ15-0046. Epub 2015 May 9. Endocr J. 2015. PMID: 25959606
-
Scutellaria baicalensis Alleviates Insulin Resistance in Diet-Induced Obese Mice by Modulating Inflammation.Int J Mol Sci. 2019 Feb 8;20(3):727. doi: 10.3390/ijms20030727. Int J Mol Sci. 2019. PMID: 30744038 Free PMC article.
-
Effects of Saikosaponin-A on Insulin Resistance in Obesity: Computational and Animal Experimental Study.Chem Pharm Bull (Tokyo). 2024;72(4):365-373. doi: 10.1248/cpb.c23-00782. Chem Pharm Bull (Tokyo). 2024. PMID: 38569867
-
Therapeutic potential of mangiferin in cancer: Unveiling regulatory pathways, mechanisms of action, and bioavailability enhancements - An updated review.Food Sci Nutr. 2023 Dec 20;12(3):1413-1429. doi: 10.1002/fsn3.3869. eCollection 2024 Mar. Food Sci Nutr. 2023. PMID: 38455223 Free PMC article. Review.
Cited by
-
Chemical profile of Ficus lyrata bark extract and its therapeutic effect on non-alcoholic fatty liver disease via regulating oxidative stress, inflammation and hepatic lipogenesis.BMC Complement Med Ther. 2025 Jul 19;25(1):280. doi: 10.1186/s12906-025-05010-w. BMC Complement Med Ther. 2025. PMID: 40684140 Free PMC article.
-
Supplementation of Mangiferin to a High-Starch Diet Alleviates Hepatic Injury and Lipid Accumulation Potentially through Modulating Cholesterol Metabolism in Channel Catfish (Ictalurus punctatus).Antioxidants (Basel). 2024 Jun 13;13(6):722. doi: 10.3390/antiox13060722. Antioxidants (Basel). 2024. PMID: 38929161 Free PMC article.
-
Mangiferin for the Management of Liver Diseases: A Review.Foods. 2023 Jun 23;12(13):2469. doi: 10.3390/foods12132469. Foods. 2023. PMID: 37444207 Free PMC article. Review.
-
Mangifera indica L., By-Products, and Mangiferin on Cardio-Metabolic and Other Health Conditions: A Systematic Review.Life (Basel). 2023 Nov 28;13(12):2270. doi: 10.3390/life13122270. Life (Basel). 2023. PMID: 38137871 Free PMC article. Review.
References
MeSH terms
Substances
Grants and funding
LinkOut - more resources
Full Text Sources
