

Placental Transcriptome Profiling in Subtypes of Diabetic Pregnancies Is Strongly Confounded by Fetal Sex
- PMID: 36499721
- PMCID: PMC9740420
- DOI: 10.3390/ijms232315388
Placental Transcriptome Profiling in Subtypes of Diabetic Pregnancies Is Strongly Confounded by Fetal Sex
Abstract
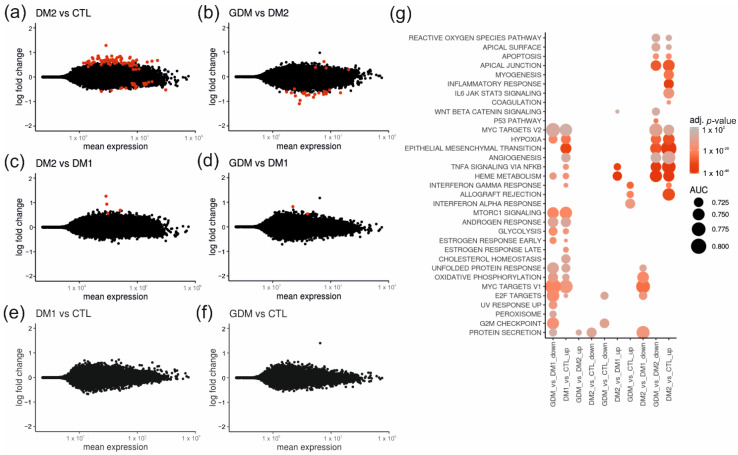
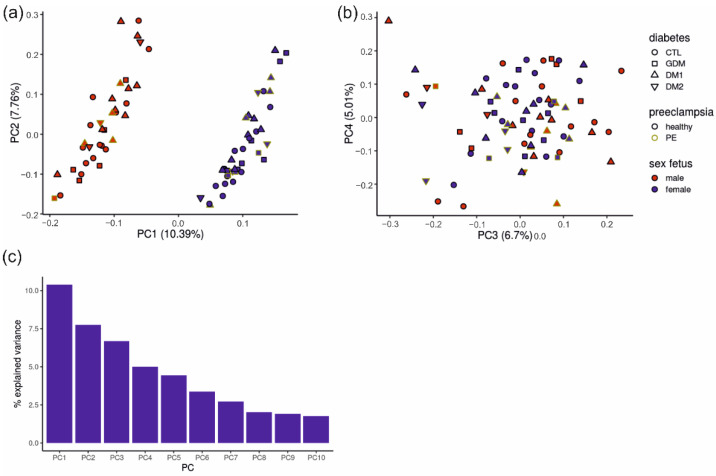
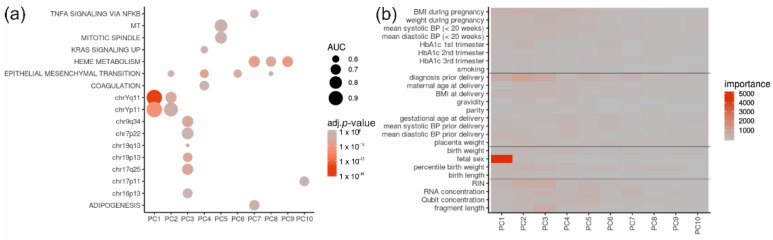
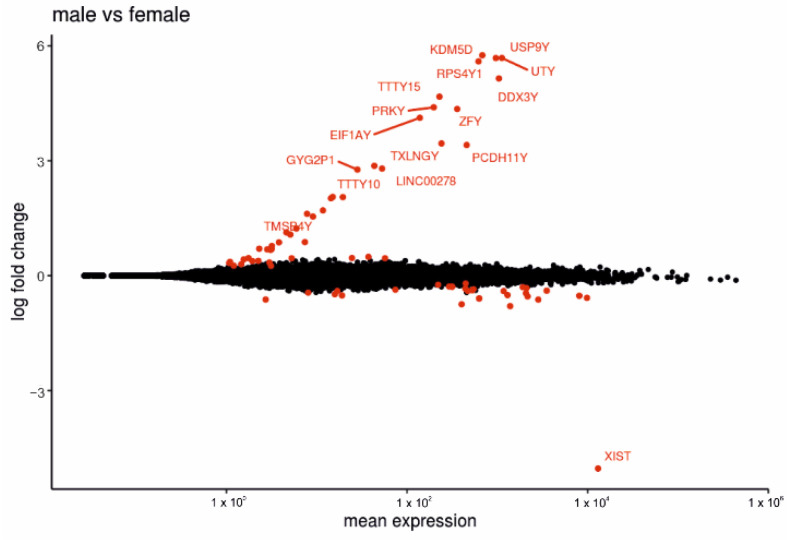
The placenta is a temporary organ with a unique structure and function to ensure healthy fetal development. Placental dysfunction is involved in pre-eclampsia (PE), fetal growth restriction, preterm birth, and gestational diabetes mellitus (GDM). A diabetic state affects maternal and fetal health and may lead to functional alterations of placental metabolism, inflammation, hypoxia, and weight, amplifying the fetal stress. The placental molecular adaptations to the diabetic environment and the adaptive spatio-temporal consequences to elevated glucose or insulin are largely unknown (2). We aimed to identify gene expression signatures related to the diabetic placental pathology of placentas from women with diabetes mellitus. Human placenta samples (n = 77) consisting of healthy controls, women with either gestational diabetes mellitus (GDM), type 1 or type 2 diabetes, and women with GDM, type 1 or type 2 diabetes and superimposed PE were collected. Interestingly, gene expression differences quantified by total RNA sequencing were mainly driven by fetal sex rather than clinical diagnosis. Association of the principal components with a full set of clinical patient data identified fetal sex as the single main explanatory variable. Accordingly, placentas complicated by type 1 and type 2 diabetes showed only few differentially expressed genes, while possible effects of GDM and diabetic pregnancy complicated by PE were not identifiable in this cohort. We conclude that fetal sex has a prominent effect on the placental transcriptome, dominating and confounding gene expression signatures resulting from diabetes mellitus in settings of well-controlled diabetic disease. Our results support the notion of placenta as a sexual dimorphic organ.
Keywords: RNA sequencing; diabetes mellitus; human; placenta; pregnancy.
Conflict of interest statement
The authors declare no conflict of interest.
Figures


Similar articles
-
Insulin-like growth factors I and II peptide and messenger RNA levels in macrosomic infants of diabetic pregnancies.J Soc Gynecol Investig. 1996 Mar-Apr;3(2):78-84. J Soc Gynecol Investig. 1996. PMID: 8796812
-
Discrete placental gene expression signatures accompany diabetic disease classifications during pregnancy.Am J Obstet Gynecol. 2025 Mar;232(3):326.e1-326.e15. doi: 10.1016/j.ajog.2024.05.014. Epub 2024 May 17. Am J Obstet Gynecol. 2025. PMID: 38763341
-
Glucose transporter (Glut1, Glut3) mRNA in human placenta of diabetic and non-diabetic pregnancies.Early Pregnancy. 1997 Sep;3(3):172-82. Early Pregnancy. 1997. PMID: 10086067
-
Placental Expression of Glucose Transporter Proteins in Pregnancies Complicated by Gestational and Pregestational Diabetes Mellitus.Can J Diabetes. 2018 Apr;42(2):209-217. doi: 10.1016/j.jcjd.2017.04.008. Epub 2017 Jun 2. Can J Diabetes. 2018. PMID: 28583471 Review.
-
Extracellular vesicles as markers and mediators of pregnancy complications: gestational diabetes, pre-eclampsia, preterm birth and fetal growth restriction.J Physiol. 2023 Nov;601(22):4973-4988. doi: 10.1113/JP282849. Epub 2023 May 8. J Physiol. 2023. PMID: 37070801 Free PMC article. Review.
Cited by
-
Pathogenesis of Pregnancy-Related Complications.Int J Mol Sci. 2023 Mar 15;24(6):5584. doi: 10.3390/ijms24065584. Int J Mol Sci. 2023. PMID: 36982657 Free PMC article.
-
An Artificial Intelligence Prediction Model of Insulin Sensitivity, Insulin Resistance, and Diabetes Using Genes Obtained through Differential Expression.Genes (Basel). 2023 Nov 23;14(12):2119. doi: 10.3390/genes14122119. Genes (Basel). 2023. PMID: 38136941 Free PMC article.
-
Maternal Gestational Diabetes Is Associated with High Risk of Childhood Overweight and Obesity: A Cross-Sectional Study in Pre-School Children Aged 2-5 Years.Medicina (Kaunas). 2023 Feb 24;59(3):455. doi: 10.3390/medicina59030455. Medicina (Kaunas). 2023. PMID: 36984456 Free PMC article.
-
Unique Ultrastructural Alterations in the Placenta Associated With Macrosomia Induced by Gestational Diabetes Mellitus.Matern Fetal Med. 2024 Jul 1;6(3):164-172. doi: 10.1097/FM9.0000000000000240. eCollection 2024 Jul. Matern Fetal Med. 2024. PMID: 40406284 Free PMC article.
-
Overexpression of Human sFLT1 in the Spongiotrophoblast Is Sufficient to Induce Placental Dysfunction and Fetal Growth Restriction in Transgenic Mice.Int J Mol Sci. 2024 Feb 7;25(4):2040. doi: 10.3390/ijms25042040. Int J Mol Sci. 2024. PMID: 38396719 Free PMC article.
References
-
- Brown M.A., Magee L.A., Kenny L.C., Karumanchi S.A., McCarthy F., Saito S., Hall D.R., Warren C.E., Adoyi G., Ishaku S. Hypertensive Disorders of Pregnancy: ISSHP Classification, Diagnosis, and Management Recommendations for International Practice. Hypertension. 2018;72:24–43. doi: 10.1161/HYPERTENSIONAHA.117.10803. - DOI - PubMed
-
- Benirschke K., Burton G.J., Baergen R.N., editors. Pathology of the Human Placenta. 6th ed. Springer; Berlin/Heidelberg, Germany: 2012.
MeSH terms
LinkOut - more resources
Full Text Sources
Medical
