. 2022 Dec 6;23(23):15441.
doi: 10.3390/ijms232315441.

Systematic Comparison of Plant Promoters in Nicotiana spp. Expression Systems

Affiliations

Systematic Comparison of Plant Promoters in Nicotiana spp. Expression Systems

Ekaterina S Shakhova et al. Int J Mol Sci. .

Abstract

We report a systematic comparison of 19 plant promoters and 20 promoter-terminator combinations in two expression systems: agroinfiltration in Nicotiana benthamiana leaves, and Nicotiana tabacum BY-2 plant cell packs. The set of promoters tested comprised those not present in previously published work, including several computationally predicted synthetic promoters validated here for the first time. The expression of EGFP driven by different promoters varied by more than two orders of magnitude and was largely consistent between two tested Nicotiana systems. We confirmed previous reports of significant modulation of expression by terminators, as well as synergistic effects of promoters and terminators. Additionally, we observed non-linear effects of gene dosage on expression level. The dataset presented here can inform the design of genetic constructs for plant engineering and transient expression assays.

Keywords: BY-2; EGFP; plant cell packs; transcription unit; transient assay.


Conflict of interest statement

The authors declare no conflict of interest. The funders had no role in the design of the study; in the collection, analyses, or interpretation of data; in the writing of the manuscript; or in the decision to publish the results.

Figures

Figure 1
Figure 1
Comparison of expression of EGFP, driven by various promoters. The tOCS terminator was used in all transcription units shown on the graph. (a,b) Agroinfiltration in N. benthamiana leaves; N = 6 leaves for each promoter, except p35s_0.4kb—TMV omega (N = 30 leaves) (c,d) Transient transformation of N. tabacum BY-2-based plant cell packs. N = 6 cell packs for each promoter; (a,c)—box and whiskers plots, the box extends from the lower to upper quartile values of the data, the vertical line represents the median. Whiskers represent a full data range; (b,d) color-coded p-values of Conover’s test. NS—non-significant.
Figure 2
Figure 2
Effect of the gene dosage on the EGFP expression in BY-2 cell packs. The colors of the boxes correspond to the OD600 of EGFP-carrying Agrobacterium upon inoculation: 0.5 (green), 0.005 (brown), and 0.0005 (blue). The order of promoters is based on level of fluorescence with OD600 = 0.005 (from strong to weak); (inset) Representative log-log plots showing linear (pMinSyn1569x, pAtTCTP) and non-linear (pCmYLCV, pFMV) changes in fluorescence upon the increase in gene dosage. N = 4 cell packs were measured for each data point.
Figure 3
Figure 3
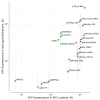
Comparison of EGFP expression within various transcription units between BY-2 plant cell packs and N. benthamiana transient expression systems. All transcription units consisted of EGFP under the control of designated promoters and either AtRBCS2B 5′UTR (synthetic promoters and p35S 0.4 kb, in purple) or native 5′UTR sequences (and TMV omega 5′UTR for p35S 0.4 kb, green dots). The tOCS terminator was used in all transcription units shown on the graph. The same dataset as Figure 1 was used. Points indicate mean values; whiskers show standard deviation.
Figure 4
Figure 4
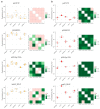
Comparison of terminators in the context of different promoters in two expression systems: (a) N. benthamiana leaf agroinfiltration (N = 4 leaves for each promoter) and (b) N. tabacum BY-2 plant cell packs (N = 6 cell packs for each promoter). Box and whisker plots (left) on each panel are accompanied by color-coded p-values of Conover’s test (right). NS—non-significant. The box extends from the lower to upper quartile values of the data, with the horizontal line representing the median. Whiskers represent a full data range.

References

    1. Amack S.C., Antunes M.S. CaMV35S Promoter—A Plant Biology and Biotechnology Workhorse in the Era of Synthetic Biology. Curr. Plant Biol. 2020;24:100179. doi: 10.1016/j.cpb.2020.100179. - DOI
    1. Rajeevkumar S., Anunanthini P., Sathishkumar R. Epigenetic Silencing in Transgenic Plants. Front. Plant Sci. 2015;6:693. doi: 10.3389/fpls.2015.00693. - DOI - PMC - PubMed
    1. Porto M.S., Pinheiro M.P.N., Batista V.G.L., dos Santos R.C., de Filho P.A.M., de Lima L.M. Plant Promoters: An Approach of Structure and Function. Mol. Biotechnol. 2014;56:38–49. doi: 10.1007/s12033-013-9713-1. - DOI - PubMed
    1. Jores T., Tonnies J., Wrightsman T., Buckler E.S., Cuperus J.T., Fields S., Queitsch C. Synthetic Promoter Designs Enabled by a Comprehensive Analysis of Plant Core Promoters. Nat. Plants. 2021;7:842–855. doi: 10.1038/s41477-021-00932-y. - DOI - PMC - PubMed
    1. Cai Y.-M., Kallam K., Tidd H., Gendarini G., Salzman A., Patron N.J. Rational Design of Minimal Synthetic Promoters for Plants. Nucleic Acids Res. 2020;48:11845–11856. doi: 10.1093/nar/gkaa682. - DOI - PMC - PubMed

MeSH terms

LinkOut - more resources