Review
. 2022 Dec 1;27(23):8421.
doi: 10.3390/molecules27238421.

Fluorescent Organic Small Molecule Probes for Bioimaging and Detection Applications

Affiliations
Review

Fluorescent Organic Small Molecule Probes for Bioimaging and Detection Applications

Yufei Yang et al. Molecules. .

Abstract

The activity levels of key substances (metal ions, reactive oxygen species, reactive nitrogen, biological small molecules, etc.) in organisms are closely related to intracellular redox reactions, disease occurrence and treatment, as well as drug absorption and distribution. Fluorescence imaging technology provides a visual tool for medicine, showing great potential in the fields of molecular biology, cellular immunology and oncology. In recent years, organic fluorescent probes have attracted much attention in the bioanalytical field. Among various organic fluorescent probes, fluorescent organic small molecule probes (FOSMPs) have become a research hotspot due to their excellent physicochemical properties, such as good photostability, high spatial and temporal resolution, as well as excellent biocompatibility. FOSMPs have proved to be suitable for in vivo bioimaging and detection. On the basis of the introduction of several primary fluorescence mechanisms, the latest progress of FOSMPs in the applications of bioimaging and detection is comprehensively reviewed. Following this, the preparation and application of fluorescent organic nanoparticles (FONPs) that are designed with FOSMPs as fluorophores are overviewed. Additionally, the prospects of FOSMPs in bioimaging and detection are discussed.

Keywords: bioimaging; detection; fluorescent organic nanoparticles; fluorescent organic small molecules; recognition mechanisms.


Conflict of interest statement

The authors declare no conflict of interest.

Figures

Figure 1
Figure 1
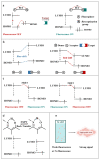
The structure of FOSMPs and its recognition of the target.
Figure 2
Figure 2
Schematic illustration of the principles of (a) PET, (b) ICT, (c) FRET, (d) ESIPT and (e) AIE.
Figure 3
Figure 3
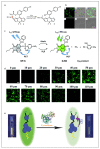
(a) The concept of a probe for Cys detection. (b) Confocal microscopy images of Cys detection in live A375 cells using probe. (i) Cells incubated with probe (20 μM) for 30 min at 37 °C, (ii) bright field of (i), (iii) merge of (i,ii), (iv) probe-treated A375 cells further incubated with Cys (1 mM) for 30 min, (v) bright field of (iv), (vi) merge of (iv,v). Reproduced with permission from Ref. [59], copyright 2016, Elsevier B.V. (c) The chemical structures and the sensing mechanism of the NP-S for detecting thiols and H2S. (d) TP imaging for mouse liver slices (Scale bar: 200 mM). Reproduced with permission from Ref. [60], copyright 2022, Royal Society of Chemistry. (e) Schematic illustration of the detection principle of tyrosinase. Reproduced with permission from Ref. [61], copyright 2020, Royal Society of Chemistry.
Figure 4
Figure 4
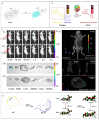
(a) The ICT mechanism of the probe. Reproduced with permission from Ref. [63], copyright 2015, Elsevier B.V. (b) The ICT mechanism of DCM-βgal. (c) (i,ii) In vivo imaging of β-gal activity in tumor-bearing nude mice after tumor injection, (iii,iv) fluorescence images of the main internal organs after anatomy, (v) three-dimensional in vivo imaging of β-gal activity in tumor-bearing nude mice after tumor injection of DCM-βgal for 3 h. (i,iii,v) Avidin-β-gal (100 μg) in PBS was intravenously injected into LoVo-implanted mice, and after 18 h DCM-βgal was then injected into the mice. (ii,iv) Tumor-bearing mice were not pretreated with avidin-β-gal before injection of DCM-βgal acting as the control. Reproduced with permission from Ref. [64], copyright 2022, American Chemical Society. (d) Theoretical calculation of HOMO/LUMO energy gaps of AI and AIO. Reproduced with permission from Ref. [67], copyright 2020, Elsevier B.V.
Figure 5
Figure 5
(a) The recognition mechanism of SR400 towards H2S. Reproduced with permission from Ref. [69], copyright 2022, Springer Nature. (b) Design of FRET Fe(II) probe FIP-1. (c) Representative confocal microscopy images of live HEK 293T cells loaded with FIP-1. Cells treated with (i) 1 mM bathophenanthroline disulfonate for 9.5 h, (ii) 250 μM deferoxamine for 9.5 h, (iii) vehicle for 90 min, (iv) 100 μM ferrous ammonium sulfate for 90 min. (vviii) Brightfield images of (iiv) overlaid with Hoechst stain. Reproduced with permission from Ref. [71], copyright 2022, American Chemical Society.
Figure 6
Figure 6
(a) Design of NIR-TS probe for SO2 detection. (b) NIR fluorescence imaging of SO2 (Na2SO3) in HeLa cells. (i) HeLa cells were incubated with the NIR-TS probe (10 µM) for 15 min. (ii) HeLa cells were pre-treated with the NIR-TS probe and then incubated with exogenous Na2SO3 (50 µM) for 10 min. (iii) HeLa cells were pretreated with the NIR-TS probe (10 µM), then incubated with Na2S2O3 (500 µM) for 30 min. (iv) NIR-TS probe-stained HeLa cells were incubated with 500 µM N-ethylmaleimide (NEM; thiol inhibitor) for 30 min, followed by Na2S2O3 for another 30 min. (v) HeLa cells were treated with the NIR-TS probe, then incubated with 1 µg mL−1 lipopolysaccharide. (vi) HeLa cells were incubated with the NIR-TS probe, then FA (200 µM) and lipopolysaccharide (1 µg mL−1) were added. (c) NIR fluorescence imaging of Na2SO3 in mice. (i) NIR-TS probe-treated (10 µM) mice. (ii,iii,v) NIR-TS probe-treated (10 µM) mice were also injected with Na2SO3, Na2S2O3 and LPS, respectively. (iv) As a control of (iii), mice were treated with NEM, followed by Na2S2O3 and the NIR-TS probe. (vi) As a control of (v), mice were treated with LPS, followed by FA and NIR-TS probe. Reproduced with permission from Ref. [76], copyright 2021, Royal Society of Chemistry. (d) Design of ratiometric fluorescence probe Py-GSH for GGT detection. (e) Responsive mechanism of Py-GSH to GGT. (f) Fluorescence images of the human tissues after stain with 10 μM Py-GSH saline for 10 min. In fluorescence tissue imaging, the emission channels at 560 ± 15 nm (Green channel) and 650 ± 15 nm (Red channel) were collected. In ratiometric imaging, the ratio of emission intensity at 560 ± 15 nm to 650 ± 15 nm was chosen as the detected signal. Λex = 488 nm. Scale bar: 2 mm. Reproduced with permission from Ref. [75], copyright 2022, Ivyspring International Publisher.
Figure 7
Figure 7
(a) Schematic representation of light-up sensing of β-gal. (b) Confocal fluorescence microscopy images of HeLa and OVCAR-3 cells incubated with TPE-Gal (10 mM) for 40 min: (iiii) HeLa cells, (ivvi) OVCAR-3 cells, and (viiix) OVCAR-3 cells pretreated with an inhibitor (50 mM) (λex = 405 nm). Reproduced with permission from Ref. [77], copyright 2022, Royal Society of Chemistry. (c) Peroxidase-catalyzed oligomerization of TT in the presence of H2O2. (d) Selective imaging and inhibition of inflammatory cells after incubation of co-cultured cells with TT. Reproduced with permission from Ref. [78], copyright 1999–2022, John Wiley & Sons, Inc.
Figure 8
Figure 8
(a) Design of AIE-Lyso-1 for specific detection of lysosomal esterase. Reproduced with permission from Ref. [80], copyright 2014, Royal Society of Chemistry. (b) Design principle of probe 1 for selective detection of Cys. Reproduced with permission from Ref. [81], copyright 2018, Royal Society of Chemistry. (c) Sensing Mechanism of NCQ for distinguishing Cys/Hcy, GSH/H2S and thiophenol. Reproduced with permission from Ref. [82], copyright 2022, American Chemical Society.
Figure 9
Figure 9
(a) Schematic illustration of the formation of C18-R-PEG FONPs via self-assembly of C18-R and synthetic copolymers and their utilization in cell imaging. Reproduced with permission from Ref. [108], copyright 2013, Published by Elsevier B.V. (b) Schematic illustration of the preparation of SA-dots via EDC-catalyzed coupling and their subsequent cell marking. Reproduced with permission from Ref. [109], copyright 2015, Royal Society of Chemistry.
Figure 10
Figure 10
(a) Schematic illustration of fabrication of Tat-AIE dots. (b) (i) Photoluminescence (PL) spectra and (ii) I/I0 intensity of TPETPAFN in THF/water mixtures with different water fractions. (c) Particle size distribution and morphology of Tat-AIE dots. (d) Fluorescence lifetime imaging (FLIM, 5 × 5 µm2) results of (i) Tat-AIE dots and (ii) Qtracker® 655. (e) In vivo fluorescence imaging of tumor cells by Tat-AIE dots. (i) Representative in vivo fluorescence images of the mouse subcutaneously injected with 1 × 10⁶ of C6 glioma cells after staining by 2 nM Tat-AIE dots. (ii) Data for Qtracker® 655 obtained under similar conditions. The inset in the middle panel showed the integrated PL intensities of the regions of interest (blue circles) at the tumor sites from the corresponding images. Reproduced with permission from Ref. [111], copyright 2022, Springer Nature.

Similar articles

Cited by

References

    1. Hao J., Yan B. A water-stable lanthanide-functionalized MOF as a highly selective and sensitive fluorescent probe for Cd2+ Chem. Commun. 2015;51:7737–7740. doi: 10.1039/C5CC01430A. - DOI - PubMed
    1. Donia M.S., Fischbach M.A. Small molecules from the human microbiota. Science. 2015;349:1254766. doi: 10.1126/science.1254766. - DOI - PMC - PubMed
    1. Fukuto J.M., Carrington S.J., Tantillo D.J., Harrison J.G., Ignarro L.J., Freeman B.A., Chen A., Wink D.A. Small Molecule Signaling Agents: The Integrated Chemistry and Biochemistry of Nitrogen Oxides, Oxides of Carbon, Dioxygen, Hydrogen Sulfide, and Their Derived Species. Chem. Res. Toxicol. 2012;25:769–793. doi: 10.1021/tx2005234. - DOI - PMC - PubMed
    1. Griendling K.K., Touyz R.M., Zweier J.L., Dikalov S., Chilian W., Chen Y., Harrison D.G., Bhatnagar A., Amer H.A.C.B. Measurement of Reactive Oxygen Species, Reactive Nitrogen Species, and Redox-Dependent Signaling in the Cardiovascular System: A Scientific Statement From the American Heart Association. Circ. Res. 2016;119:E39–E75. doi: 10.1161/RES.0000000000000110. - DOI - PMC - PubMed
    1. Jiao X., Li Y., Niu J., Xie X., Wang X., Tang B. Small-Molecule Fluorescent Probes for Imaging and Detection of Reactive Oxygen, Nitrogen, and Sulfur Species in Biological Systems. Anal. Chem. 2018;90:533–555. doi: 10.1021/acs.analchem.7b04234. - DOI - PubMed

LinkOut - more resources