. 2022 Dec 2;27(23):8449.
doi: 10.3390/molecules27238449.

Tetrel Bonding in Anion Recognition: A First Principles Investigation

Affiliations

Tetrel Bonding in Anion Recognition: A First Principles Investigation

Pradeep R Varadwaj. Molecules. .

Abstract

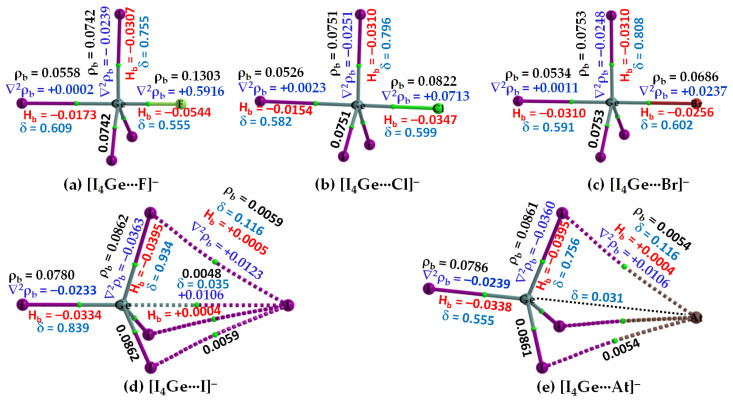
Twenty-five molecule-anion complex systems [I4Tt···X-] (Tt = C, Si, Ge, Sn and Pb; X = F, Cl, Br, I and At) were examined using density functional theory (ωB97X-D) and ab initio (MP2 and CCSD) methods to demonstrate the ability of the tetrel atoms in molecular entities, I4Tt, to recognize the halide anions when in close proximity. The tetrel bond strength for the [I4C···X-] series and [I4Tt···X-] (Tt = Si, Sn; X = I, At), was weak-to-moderate, whereas that in the remaining 16 complexes was dative tetrel bond type with very large interaction energies and short Tt···X close contact distances. The basis set superposition error corrected interaction energies calculated with the highest-level theory applied, [CCSD(T)/def2-TZVPPD], ranged from -3.0 to -112.2 kcal mol-1. The significant variation in interaction energies was realized as a result of different levels of tetrel bonding environment between the interacting partners at the equilibrium geometries of the complex systems. Although the ωB97X-D computed intermolecular geometries and interaction energies of a majority of the [I4Tt···X-] complexes were close to those predicted by the highest level of theory, the MP2 results were shown to be misleading for some of these systems. To provide insight into the nature of the intermolecular chemical bonding environment in the 25 molecule-anion complexes investigated, we discussed the charge-density-based topological and isosurface features that emanated from the application of the quantum theory of atoms in molecules and independent gradient model approaches, respectively.

Keywords: MESP analysis; anion recognition; charge-density analysis; chemical bonding; dative bond formation; first-principles calculations; non-covalent interactions; tetrel bond; weak-to-strong interaction energy.


Conflict of interest statement

The author declares no conflict of interest. The funders had absolutely no role in the design of the study; in the collection, analyses, or interpretation of data; in the writing of the manuscript; or in the decision to publish the results.

Figures

Figure 1
Figure 1
Illustration of molecule–anion interactions in the anionic part of some selected chemical systems cataloged in the CSD [9]. The crystals include: (a) bis(tetrabutylammonium) dodecachlorohexasilinane bis(iodide) dichloromethane solvate [2(C16H36N+),Cl12Si6,CH2Cl2,2(I)] [12]; (b) bis(tetrabutylammonium) bis(bromide) dodecabromohexasilinane [2(C16H36N+),Br12Si6,2(Br)] [13]; (c) bis(tetrabutylphosphanium) dodecaiodohexasilinane bis(iodide) [2(C16H36P+),I12Si6,2(I)] [13]; (d) bis(tetraphenylphosphonium) 1,1,2,2,3,4,4,5,5,6-decachloro-3,6-bis(trichlorosilyl)hexasilinane bis(chloride) [2(C24H20P+),Cl16Si8,2(Cl)] [14]; (e) triphenyl-N-(triphenylphosphanylidene)phosphaniminium chloride 1,2,3,4,5,6,7,8,9,10,11,12,13,14,15,16,17,18,19,20-icosachloroundecacyclo [9.9.0.02,9.03,7.04,20.05,18.06,16.08,15.010,14.012,19.013,17]icosasilane chloroform solvate [C36H30NP2+,Cl20Si20,2(CHCl3),Cl] [15]; (f) bis(triphenyl-N-(triphenylphosphanylidene)phosphaniminium) chloride 4-methylbenzene-1-sulfonate 1,3,5,8,10,13,16,19-octachloroundecacyclo [9.9.0.02,9.03,7.04,20.05,18.06,16.08,15.010,14.012,19.013,17]icosasilane [2(C36H30NP2+),H12Cl8Si20,C7H7O3S,Cl] [15]. The CSD reference codes are depicted in uppercase letters. Selected bond distances and bond angles associated with the (H−)Si···Cl and/or (X−)Si···X (X = Cl Br, I) contacts are in Å and degree, respectively. Atom labeling is shown for selected atoms.
Figure 2
Figure 2
(Top) [ωB97X-D/def2-QZVPPD] level QTAIM-based molecular graphs of isolated TtI4 (Tt = C, Si, Ge, Sn, and Pb), showing bond paths (solid lines in atom color) and bond critical points (tiny spheres in green) between bonded atomic basins (large spheres). The charge density(ρb), the Laplacian of the charge density (∇2ρb), the total energy density (Hb), and the delocalization index (δ) values are shown in black, blue, red, and faint-blue fonts (in a.u.), respectively. (Bottom) The 0.001 a.u. (electrons bohr−3) isoelectron density mapped potential on the electrostatic surfaces of the corresponding monomers, including (a) CI4, (b) SiI4, (c) GeI4, (d) SnI4, and (e) PbI4. The strength of Tt’s and I’s σ-holes is shown in each case; filled tiny blue and red circles represent VS,min and VS,max, respectively; VS,min and VS,max values are in kcal mol−1.
Figure 3
Figure 3
The dependence of polarizability of Tt derivative on the strength of the σ-hole on Tt in TtI4, computed using [ωB97X-D/def2-QZVPPD]. The (polarizability, σ-hole) data for each molecule are indicated. The square of the regression coefficient R2 is shown, together with the linear equation that connects polarizability with the strength of the σ-hole.
Figure 4
Figure 4
(ae) [ωB97X-D/def2-QZVPPD] level QTIM-based molecular graphs of [I4C···X], showing the bond paths (solid and dotted lines in atom color) and bond critical points (tiny spheres in green) between bonded atomic basins. Large spheres represent the atomic basins. The dotted black line in (be) is artificially drawn to represent the presence of tetrel bond between C and X (X = Cl, Br, I, At). The charge density (ρb), the Laplacian of the charge density (∇2ρb), the total energy density (Hb), and the delocalization index (δ) values are shown in black, blue, red, and faint-blue fonts (in a.u.), respectively.
Figure 5
Figure 5
(ae) [ωB97X-D/def2-QZVPPD] level QTIM-based molecular graphs of [I4Si···X] (X = F, Cl, Br, I, At), showing the bond paths (solid and dotted lines in atom color) and bond critical points (tiny spheres in green) between bonded atomic basins. Large spheres represent the atomic basins, with atoms labeled. The dotted black line in (d,e) is artificially drawn to represent the presence of tetrel bond between Si and X (X = I, At). The charge density (ρb), the Laplacian of the charge density (∇2ρb), the total energy density (Hb), and the delocalization index (δ) values are shown in black, blue, red, and faint-blue fonts (in a.u.), respectively.
Figure 6
Figure 6
(ae) [ωB97X-D/def2-QZVPPD] level QTIM-based molecular graphs of [I4Ge···X] (X = F, Cl, Br, I, At), showing the bond paths (solid and dotted lines in atom color) and bond critical points (tiny spheres in green) between bonded atomic basins. Large spheres represent the atomic basins, with atoms labeled. The dotted black line in (e) is artificially drawn to represent the presence of tetrel bond between Ge and At. The charge density (ρb), the Laplacian of the charge density (∇2ρb), the total energy density (Hb), and the delocalization index (δ) values are shown in black, blue, red, and faint-blue fonts (in a.u.), respectively.
Figure 7
Figure 7
(ae) [ωB97X-D/def2-QZVPPD] level QTIM-based molecular graphs of [I4Sn···X] (X = F, Cl, Br, I, At), showing the bond paths (solid and dotted lines in atom color) and bond critical points (tiny spheres in green) between bonded atomic basins. Large spheres represent the atomic basins, with atoms labeled. The charge density(ρb), the Laplacian of the charge density (∇2ρb), the total energy density (Hb), and the delocalization index (δ) values are shown in black, blue, red, and faint-blue fonts (in a.u.), respectively.
Figure 8
Figure 8
(ae) [ωB97X-D/def2-QZVPPD] level QTIM-based molecular graphs of [I4Pb···X] (X = F, Cl, Br, I, At), showing the bond paths (solid and dotted lines in atom color) and bond critical points (tiny spheres in green) between bonded atomic basins. Large spheres represent the atomic basins, with atoms labeled. The charge density (ρb), the Laplacian of the charge density (∇2ρb), the total energy density (Hb), and the delocalization index (δ) values are shown in black, blue, red, and faint-blue fonts (in a.u.), respectively.
Figure 9
Figure 9
(ae) [ωB97X-D/def2-QZVPPD] level IGM-δginter-based isosurface (bluish-green or green volumes) plots of [I4C···X] (X = F, Cl, Br, I, At), showing possible I···X halogen bonded and C···X tetrel bonded interactions between interacting molecular entities. (Top) Illustration of I···X Type-I halogen-halogen bonded interactions between the interacting units that appear with larger isovalues. (Bottom) Illustration of C···X tetrel bonded interactions between the interacting units that appear at smaller isovalues. Anion derivatives are labeled.
Figure 10
Figure 10
(ae) [ωB97X-D/def2-QZVPPD] level IGM-δginter-based isosurface (bluish-red or green volumes) plots for [I4Si···X] (X = F, Cl, Br, I, At), showing possible I···X halogen-halogen bonded and Si···X tetrel bonded interactions between interacting molecular entities.
Figure 11
Figure 11
(ae) [ωB97X-D/def2-QZVPPD] level IGM-δginter-based isosurface plots (bluish-red volumes) of [I4Pb···X] (X = F, Cl, Br, I, At), showing possible Pb···X tetrel bonded interactions between interacting molecular entities.
Figure 12
Figure 12
(a) The [ωB97X-D/def2-QZVPPD] level quadratic dependence of BSSE corrected interaction energy (Eint(BSSE)) on the distance of separation r(Tt···X) for 25 [I4Tt···X] (Tt = C, Si, Ge, Sn, Pb; X = F, Cl, Br, I, At) molecule–anion complexes. Shown in (b,c) are the corresponding dependences obtained using [MP2/def2-QZVPPD] and [CCSD(T)/def2-TZVPPD], respectively. Shown in (df) are the linear dependences between Eint(BSSE) and Eint obtained with [ωB97X-D/def2-QZVPPD], [MP2/def2-QZVPPD] and [CCSD(T)/def2-TZVPPD], respectively.

Similar articles

Cited by

References

    1. Sethio D., Raggi G., Lindh R., Erdélyi M. Halogen Bond of Halonium Ions: Benchmarking DFT Methods for the Description of NMR Chemical Shifts. J. Chem. Theory Comput. 2020;16:7690–7701. doi: 10.1021/acs.jctc.0c00860. - DOI - PMC - PubMed
    1. Chen Y., Wang D.-X., Huang Z.-T., Wang M.-X. Ion Pair Receptors Based on Anion–π Interaction. Chem. Commun. 2011;47:8112–8114. doi: 10.1039/c1cc12075a. - DOI - PubMed
    1. Beer P.D., Gale P.A. Anion Recognition and Sensing: The State of the Art and Future Perspectives. Angew. Chem. Int. Ed. 2001;40:486–516. doi: 10.1002/1521-3773(20010202)40:3<486::AID-ANIE486>3.0.CO;2-P. - DOI - PubMed
    1. Lim J.Y.C., Beer P.D. Sigma-Hole Interactions in Anion Recognition. Chem. 2018;4:731–783. doi: 10.1016/j.chempr.2018.02.022. - DOI
    1. Yu B., Pletka C.C., Iwahara J. Quantifying and Visualizing Weak Interactions between Anions and Proteins. Proc. Natl. Acad. Sci. USA. 2021;118:e2015879118. doi: 10.1073/pnas.2015879118. - DOI - PMC - PubMed

LinkOut - more resources