Laser-Induced µ-Rooms for Osteocytes on Implant Surface: An In Vivo Study
- PMID: 36500852
- PMCID: PMC9737095
- DOI: 10.3390/nano12234229
Laser-Induced µ-Rooms for Osteocytes on Implant Surface: An In Vivo Study
Abstract
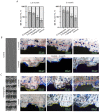
Laser processing of dental implant surfaces is becoming a more widespread replacement for classical techniques due to its undeniable advantages, including control of oxide formation and structure and surface relief at the microscale. Thus, using a laser, we created several biomimetic topographies of various shapes on the surface of titanium screw-shaped implants to research their success and survival rates. A distinctive feature of the topographies is the presence of "µ-rooms", which are special spaces created by the depressions and elevations and are analogous to the µ-sized room in which the osteocyte will potentially live. We conducted the comparable in vivo study using dental implants with continuous (G-topography with µ-canals), discrete (S-topography with μ-cavities), and irregular (I-topography) laser-induced topographies. A histological analysis performed with the statistical method (with p-value less than 0.05) was conducted, which showed that G-topography had the highest BIC parameter and contained the highest number of mature osteocytes, indicating the best secondary stability and osseointegration.
Keywords: biocompatibility; in vivo; laser texturing; osseointegration; rabbit tibia; titanium implants; topography.
Conflict of interest statement
The authors declare that they have no competing financial interests or personal relationships that could have appeared to influence the work reported in this paper.
Figures


Similar articles
-
The effects of controlled nanotopography, machined topography and their combination on molecular activities, bone formation and biomechanical stability during osseointegration.Acta Biomater. 2021 Dec;136:279-290. doi: 10.1016/j.actbio.2021.10.001. Epub 2021 Oct 6. Acta Biomater. 2021. PMID: 34626821
-
Titanium nanotopography induces osteocyte lacunar-canalicular networks to strengthen osseointegration.Acta Biomater. 2022 Oct 1;151:613-627. doi: 10.1016/j.actbio.2022.08.023. Epub 2022 Aug 20. Acta Biomater. 2022. PMID: 35995407
-
What is the Best Micro and Macro Dental Implant Topography?Dent Clin North Am. 2019 Jul;63(3):447-460. doi: 10.1016/j.cden.2019.02.010. Epub 2019 Apr 12. Dent Clin North Am. 2019. PMID: 31097137 Review.
-
Micro/Nanostructured Topography on Titanium Orchestrates Dendritic Cell Adhesion and Activation via β2 Integrin-FAK Signals.Int J Nanomedicine. 2022 Nov 1;17:5117-5136. doi: 10.2147/IJN.S381222. eCollection 2022. Int J Nanomedicine. 2022. PMID: 36345509 Free PMC article.
-
Laser surface texturing of zirconia-based ceramics for dental applications: A review.Mater Sci Eng C Mater Biol Appl. 2021 Apr;123:112034. doi: 10.1016/j.msec.2021.112034. Epub 2021 Mar 11. Mater Sci Eng C Mater Biol Appl. 2021. PMID: 33812647 Review.
Cited by
-
Study on Surface Roughness, Morphology, and Wettability of Laser-Modified Powder Metallurgy-Processed Ti-Graphite Composite Intended for Dental Application.Bioengineering (Basel). 2023 Dec 9;10(12):1406. doi: 10.3390/bioengineering10121406. Bioengineering (Basel). 2023. PMID: 38135997 Free PMC article.
-
Influence of Hybrid Surface Modification on Biocompatibility and Physicochemical Properties of Ti-6Al-4V ELI Titanium.J Funct Biomater. 2024 Feb 20;15(3):52. doi: 10.3390/jfb15030052. J Funct Biomater. 2024. PMID: 38535245 Free PMC article.
References
-
- Butera A., Pascadopoli M., Pellegrini M., Gallo S., Zampetti P., Scribante A. Oral Microbiota in Patients with Peri-Implant Disease: A Narrative Review. Appl. Sci. 2022;12:3250. doi: 10.3390/app12073250. - DOI
Grants and funding
LinkOut - more resources
Full Text Sources
Research Materials

