

Towards Wireless Detection of Surface Modification of Silicon Nanowires by an RF Approach
- PMID: 36500858
- PMCID: PMC9735642
- DOI: 10.3390/nano12234237
Towards Wireless Detection of Surface Modification of Silicon Nanowires by an RF Approach
Abstract
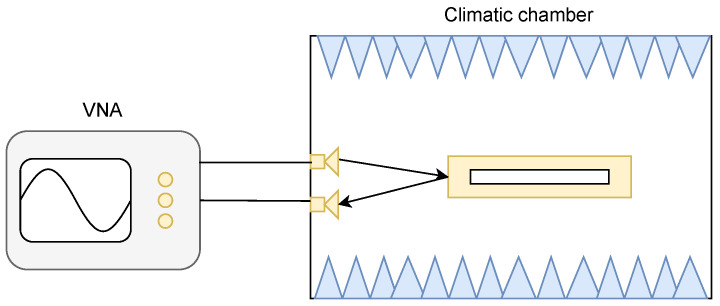
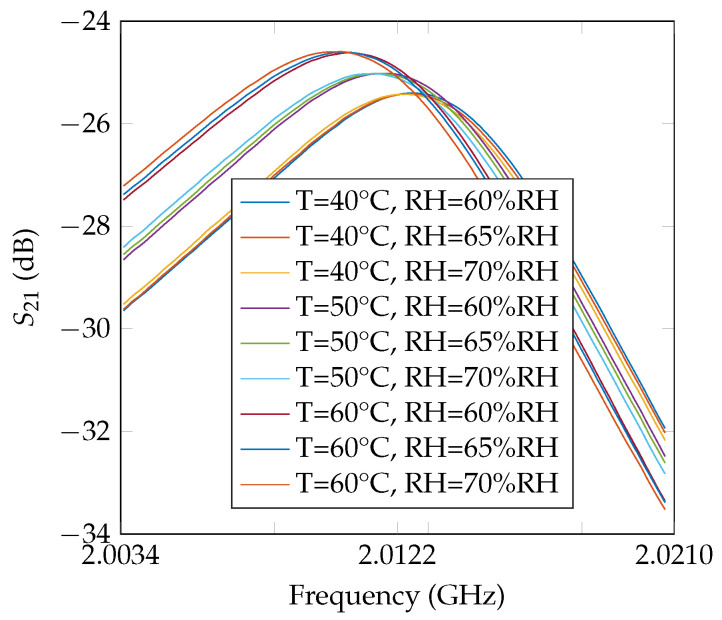
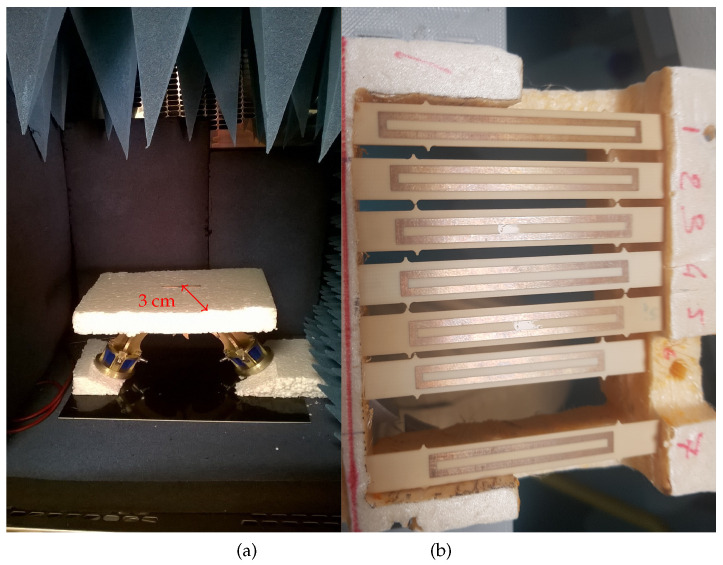
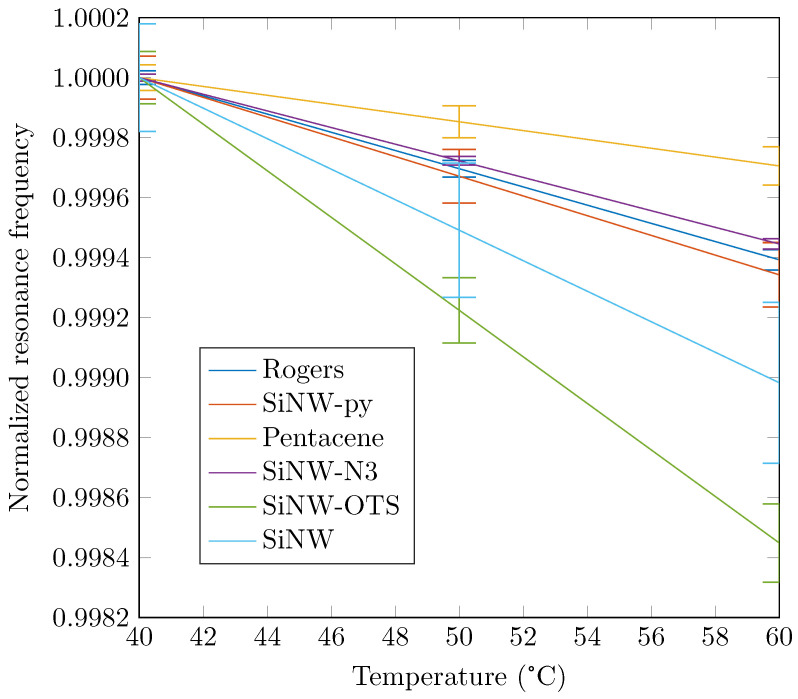
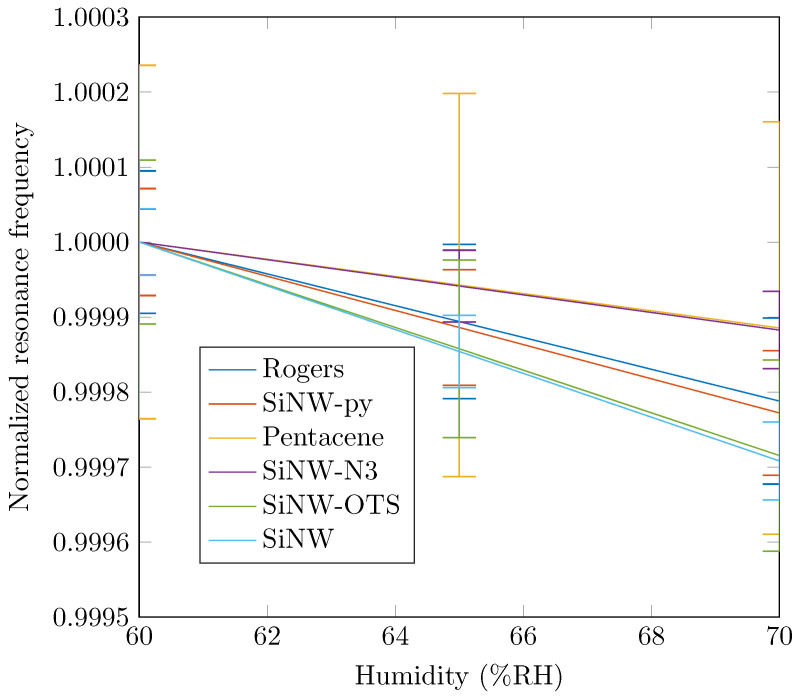
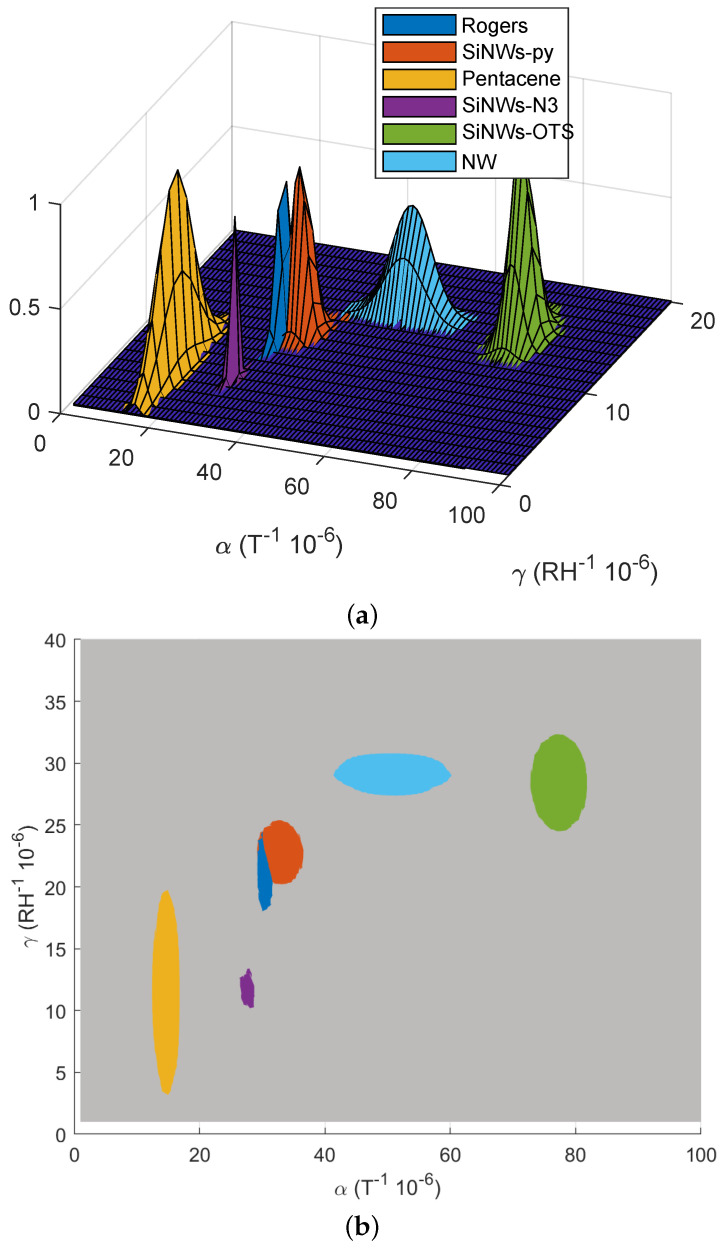
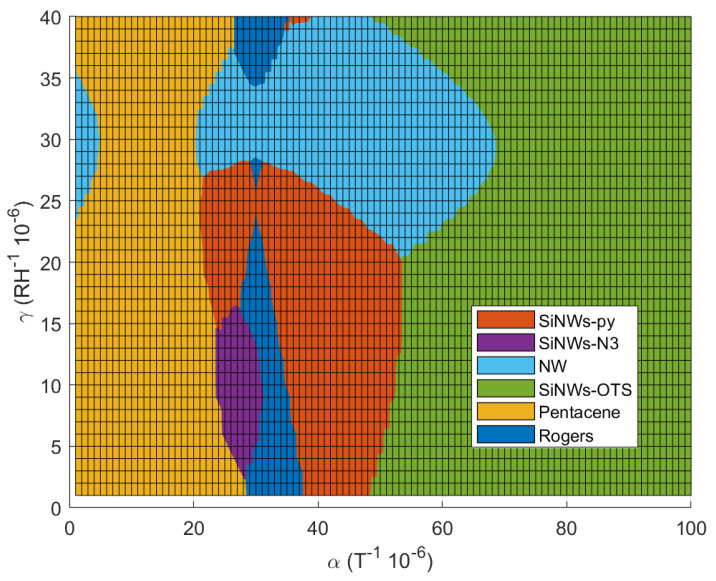
This paper shows the possibility to detect the presence of grafted molecules on the surface of silicon nanowires with a wireless RF radar approach based on the measurement of the backscattered signal of a resonant structure on which the nanowires are deposited. The measured resonance frequency allows the determination of the intrinsic properties related to temperature and humidity variations, which can be related to the presence of the grafted molecules. Several functionalizations of nanowires have been realized and characterized. For the first time, an RF approach is used to detect significant differences related to the presence of grafted molecules on the surface of nanowires. In addition to detecting their presence, the obtained results show the potential of the radar approach to identify the type of functionalization of nanowires. A set of six different grafted molecules (including octadecyltrichlorosilane, ethynylpyrene, N3) was tested and correctly separated with the proposed approach. Various measurements of the same samples showed a good repeatability which made the approach compatible with the possibility of differentiating the molecules with each other by radar reading. Moreover, discussions about the application of such functionalizations are made to increase the sensibility of sensors using a radar approach.
Keywords: RF characterization; humidity dependency; physicochemical characterization; radar; silicon nanowires; surface functionalization; temperature dependency; wireless measurement.
Conflict of interest statement
The funders had no role in the design of the study; in the collection, analyses, or interpretation of data; in the writing of the manuscript, or in the decision to publish the results.
Figures
Similar articles
-
Functionalization and Characterization of Silicon Nanowires for Sensing Applications: A Review.Nanomaterials (Basel). 2021 Apr 13;11(4):999. doi: 10.3390/nano11040999. Nanomaterials (Basel). 2021. PMID: 33924658 Free PMC article. Review.
-
Silicon nanowires-based biosensors for the electrical detection of Escherichia coli.Biosens Bioelectron. 2022 Nov 15;216:114625. doi: 10.1016/j.bios.2022.114625. Epub 2022 Aug 17. Biosens Bioelectron. 2022. PMID: 35995028
-
Soft, Wirelessly Powered Humidity Sensor Based on SnO2 Nanowires for Wireless/Wearable Sensor Application.Materials (Basel). 2020 May 8;13(9):2176. doi: 10.3390/ma13092176. Materials (Basel). 2020. PMID: 32397314 Free PMC article.
-
Wireless measurement of temperature using surface acoustic waves sensors.IEEE Trans Ultrason Ferroelectr Freq Control. 2004 Nov;51(11):1457-63. doi: 10.1109/tuffc.2004.1367486. IEEE Trans Ultrason Ferroelectr Freq Control. 2004. PMID: 15600090
-
Silicon nanowires as field-effect transducers for biosensor development: a review.Anal Chim Acta. 2014 May 12;825:1-25. doi: 10.1016/j.aca.2014.03.016. Epub 2014 Mar 15. Anal Chim Acta. 2014. PMID: 24767146 Review.
Cited by
-
Functional Nanomaterials for Sensing and Detection.Nanomaterials (Basel). 2024 Jan 4;14(1):128. doi: 10.3390/nano14010128. Nanomaterials (Basel). 2024. PMID: 38202583 Free PMC article.
References
-
- Luo L., Jie J., Zhang W., He Z., Wang J., Yuan G., Zhang W., Wu L.C.M., Lee S.T. Silicon nanowire sensors for Hg2+ and Cd2+ ions. Appl. Phys. Lett. 2009;94:193101. doi: 10.1063/1.3120281. - DOI
-
- Zhou X., Hu J., Li C., Ma D., Lee C., Lee S. Silicon nanowires as chemical sensors. Chem. Phys. Lett. 2003;369:220–224. doi: 10.1016/S0009-2614(02)02008-0. - DOI
-
- Shao M., Ma D.D.D., Lee S.T. Silicon nanowires–synthesis, properties, and applications. Eur. J. Inorg. Chem. 2010;2010:4264–4278. doi: 10.1002/ejic.201000634. - DOI
-
- Chen W., Yao H., Tzang C.H., Zhu J., Yang M., Lee S.T. Silicon nanowires for high-sensitivity glucose detection. Appl. Phys. Lett. 2006;88:213104. doi: 10.1063/1.2206102. - DOI
Grants and funding
LinkOut - more resources
Full Text Sources
