. 2022 Nov 25;14(23):5025.
doi: 10.3390/nu14235025.

Puerariae lobatae Radix Alleviates Pre-Eclampsia by Remodeling Gut Microbiota and Protecting the Gut and Placental Barriers

Affiliations

Puerariae lobatae Radix Alleviates Pre-Eclampsia by Remodeling Gut Microbiota and Protecting the Gut and Placental Barriers

Liping Huang et al. Nutrients. .

Abstract

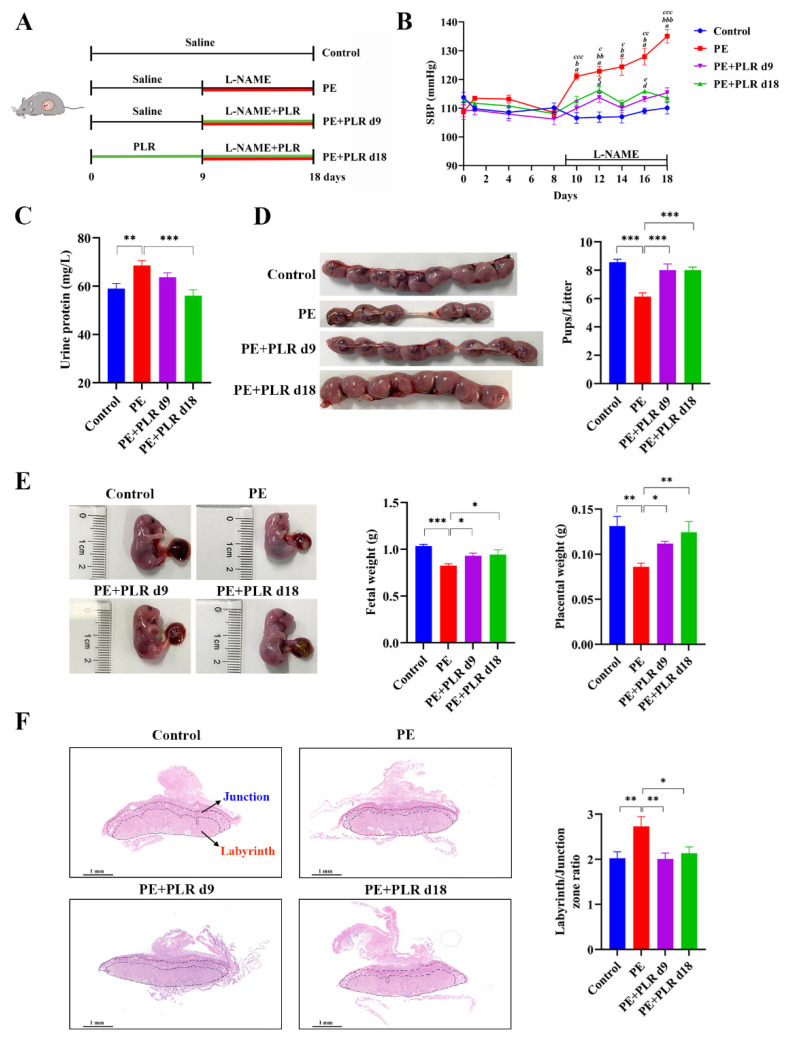
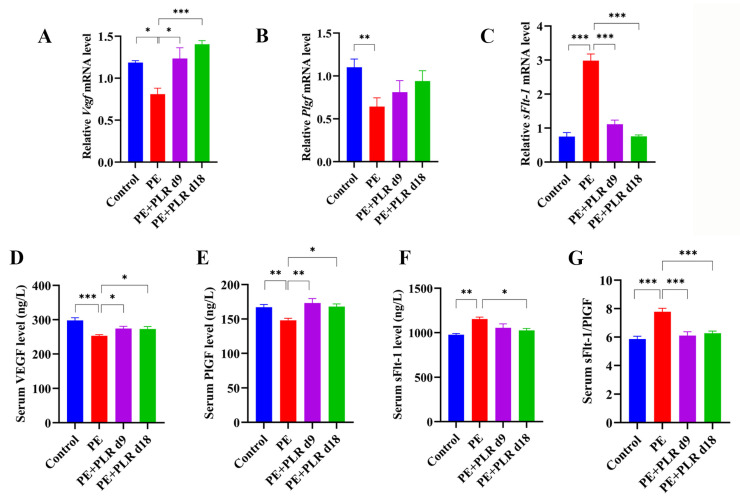
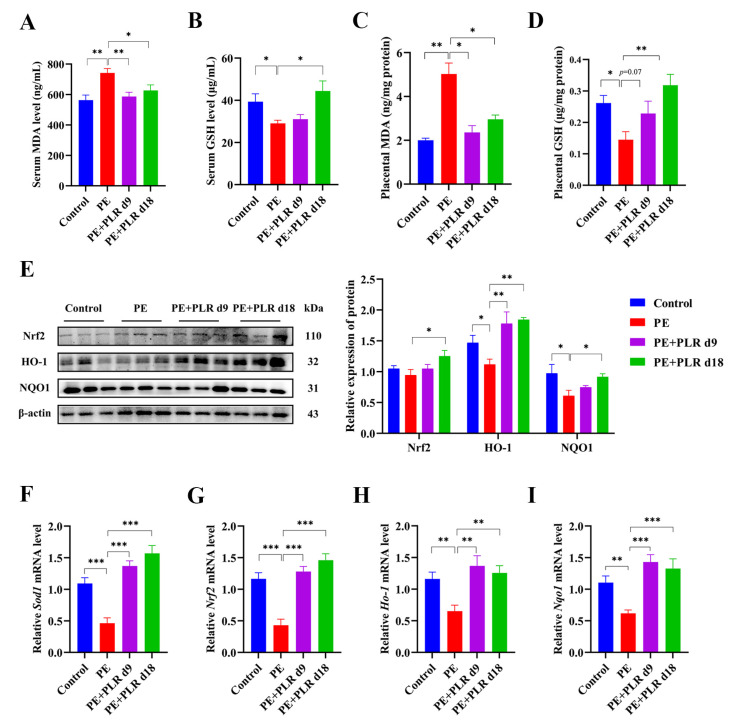
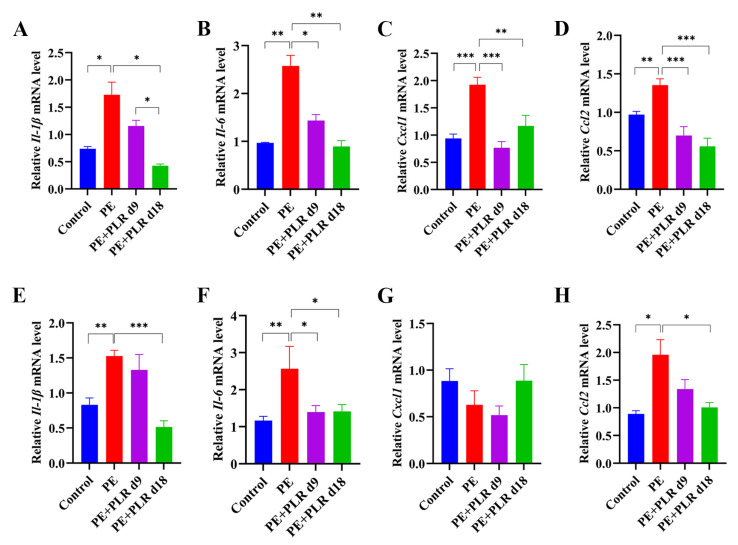
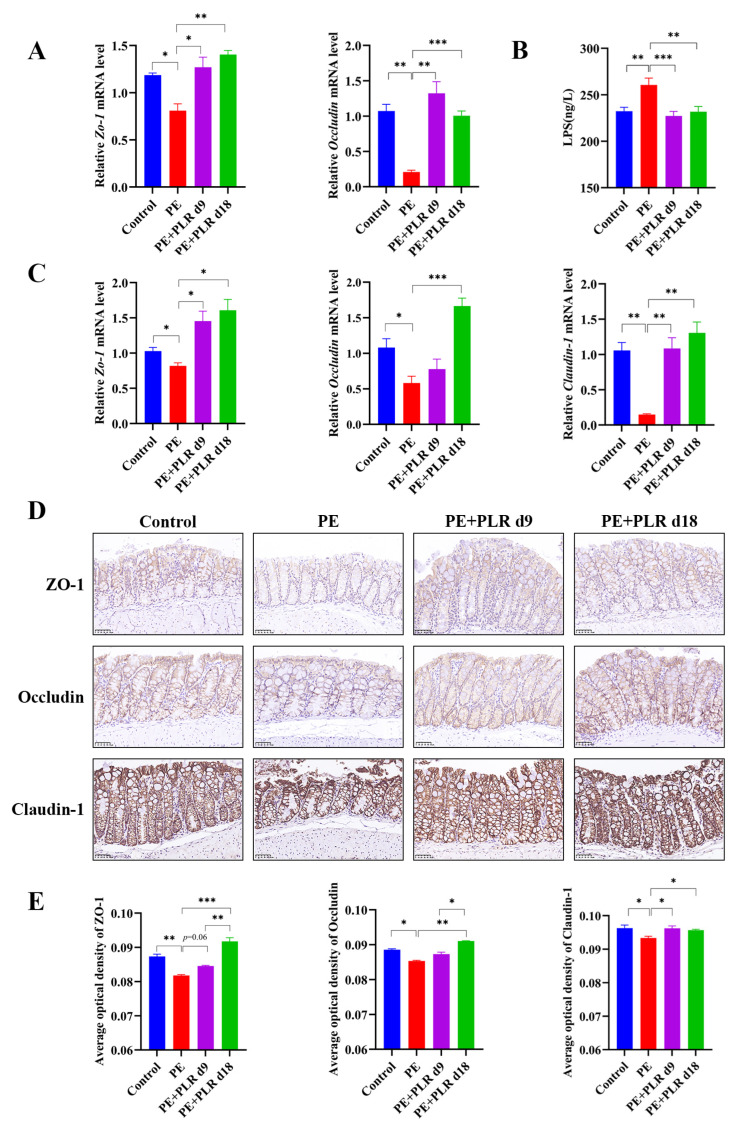
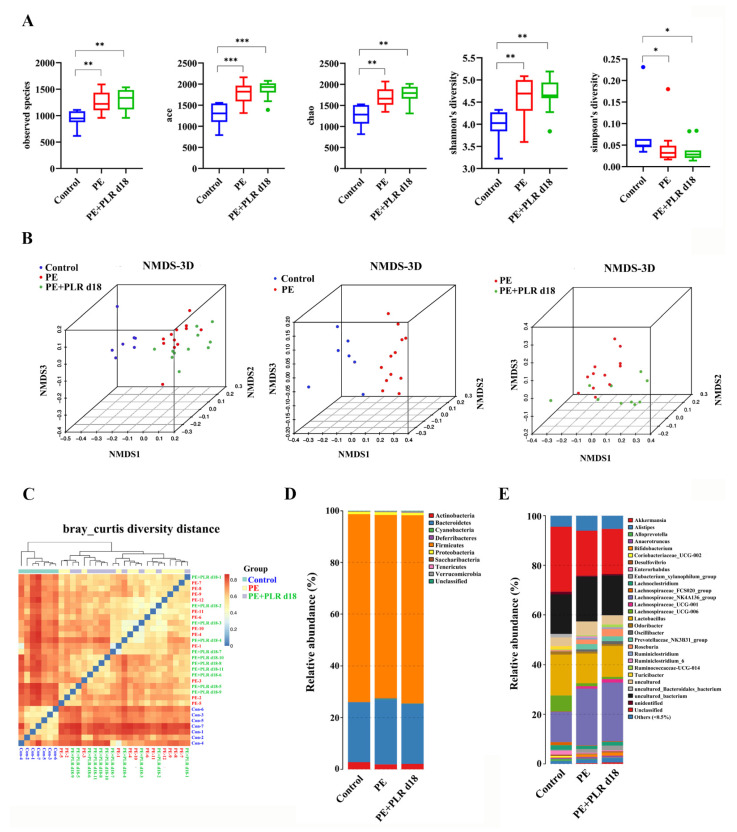
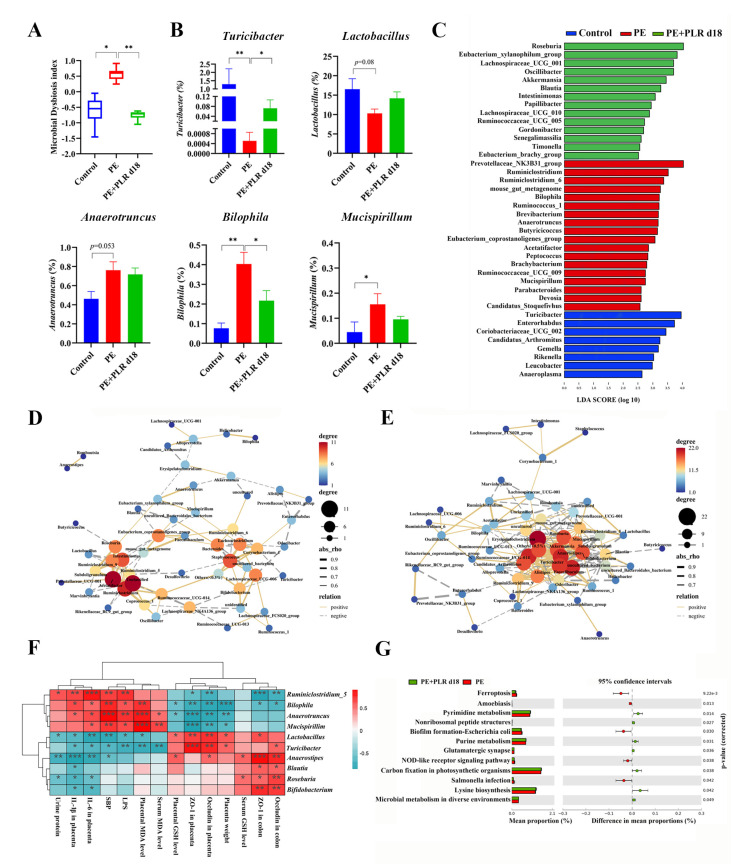
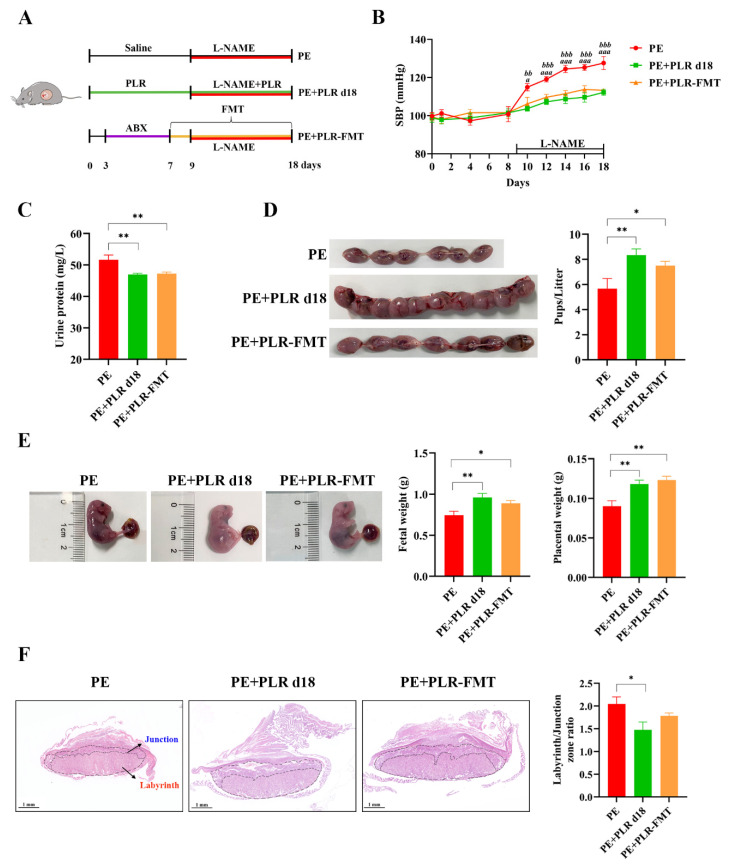
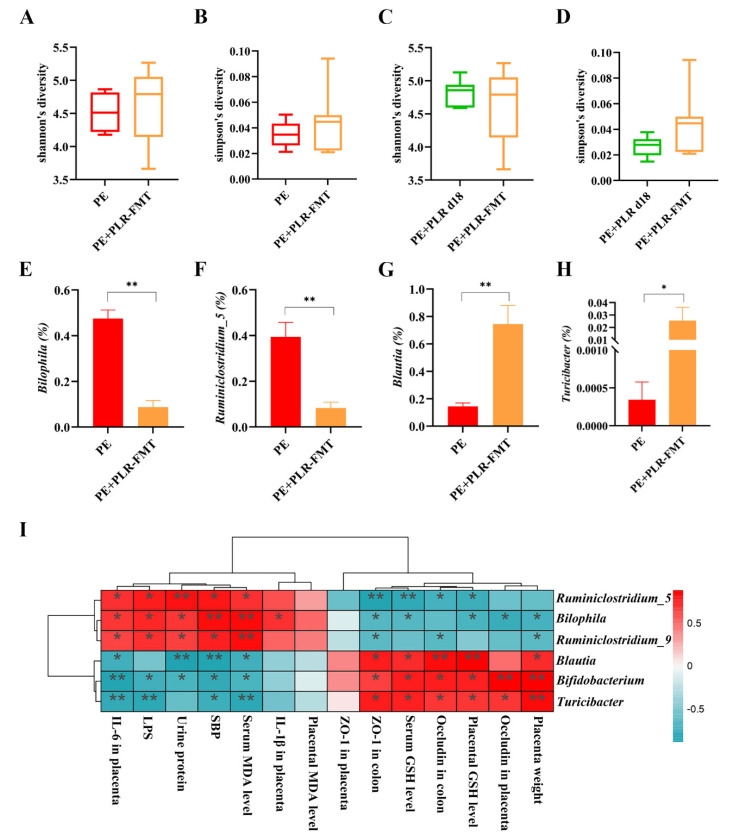
Pre-eclampsia (PE) is a serious pregnancy complication, and gut dysbiosis is an important cause of it. Puerariae lobatae Radix (PLR) is a medicine and food homologous species; however, its effect on PE is unclear. This study aimed to investigate the efficacy of PLR in alleviating PE and its mechanisms. We used an NG-nitro-L-arginine methyl ester (L-NAME)-induced PE mouse model to examine the efficacy of preventive and therapeutic PLR supplementation. The results showed that both PLR interventions alleviated hypertension and proteinuria, increased fetal and placental weights, and elevated the levels of VEGF and PlGF. Moreover, PLR protected the placenta from oxidative stress via activating the Nrf2/HO-1/NQO1 pathway and mitigated placental damage by increasing intestinal barrier markers (ZO-1, Occludin, and Claudin-1) expression and reducing lipopolysaccharide leakage. Notably, preventive PLR administration corrected gut dysbiosis in PE mice, as evidenced by the increased abundance and positive interactions of beneficial bacteria including Bifidobacterium, Blautia, and Turicibacter. Fecal microbiota transplantation confirmed that the gut microbiota partially mediated the beneficial effects of PLR on PE. Our findings revealed that modulating the gut microbiota is an effective strategy for the treatment of PE and highlighted that PLR might be used as an intestinal nutrient supplement in PE patients.

Keywords: Puerariae lobatae Radix; fecal microflora transplantation; gut microbiota; gut-placenta axis; pre-eclampsia.


Conflict of interest statement

The authors declare no conflict of interest.

Figures

Figure 1
Figure 1
Puerariae lobatae Radix (PLR) alleviated pre-eclampsia (PE)-like symptoms in NG-nitro-L-arginine methyl ester (L-NAME)-induced mice. (A) The schematic diagram of the experimental design and procedure. (B) Systolic blood pressure (SBP) of the four groups was measured non-invasively. a indicates p < 0.001 for the Control group versus the PE group on the corresponding day. b indicates p < 0.05, bb indicates p < 0.01, and bbb indicates p < 0.001 for the PE+PLR d9 group versus the PE group on the corresponding day. c indicates p < 0.05, cc indicates p < 0.01, and ccc indicates p < 0.001 for the PE+PLR d18 group versus the PE group on the corresponding day. d indicates p < 0.05 for the Control group versus the PE+PLR d9 group on the corresponding day. e indicates p < 0.05 for the Control group versus the PE+PLR d18 group on the corresponding day. (C) The 24 h proteinuria on GD18. (D) Number of pups per litter. (E) Fetal weight and placental weight. (F) Representative images of H&E-stained midsagittal placental tissue sections used in histomorphological analysis (original magnification, ×25; scale bar, 1 mm). Zones are marked and indicated by labyrinth zone and junctional zone. For (B,D,E), n = 8 for each group. For (C), n = 7 for each group. For (F), n = 6 for each group. Data are expressed as the mean ± SEM. * p < 0.05, ** p < 0.01, *** p < 0.001 (ANOVA test).
Figure 2
Figure 2
PLR reversed the angiogenic imbalance in PE mice. (AC) Relative mRNA levels of Vegf, Plgf, and sFlt-1 in placenta. (DF) Serum levels of VEGF, PlGF, and sFlt-1 were measured by ELISA. (G) The ratio of sFlt-1 and PlGF was calculated using ELISA results. For (AC), n = 6 for each group. For (DG), n = 8 for each group. Data are expressed as the mean ± SEM. * p < 0.05, ** p < 0.01, *** p < 0.001 (ANOVA test).
Figure 3
Figure 3
PLR attenuated oxidative stress and upregulated the placental Nrf2/HO-1/NQO1 pathway in PE mice. (AD) ELISA was used to analyze the concentrations of malondialdehyde (MDA) and glutathione (GSH) in the placenta and serum of different groups. (E) Representative Western blot bands and the relative density analysis results of Nrf2, HO-1, and NQO1 in placenta. β-actin was set as a loading control, and the relative expressions were normalized to the control. (FI) Relative mRNA levels of Sod1, Nrf2, Ho-1, and Nqo1 in placenta. For (AD), n = 8 for each group. For (E), n = 3 for each group. For (FI), n = 6 for each group. Data are expressed as the mean ± SEM. * p < 0.05, ** p < 0.01, *** p < 0.001 (ANOVA test).
Figure 4
Figure 4
PLR attenuated gut and placental inflammation in PE mice. (AD) Relative mRNA levels of interleukin-1β (Il-1β), interleukin-6 (Il-6), C-X-C motif chemokine ligand 1 (Cxcl1), and C-C motif chemokine ligand 2 (Ccl2) in placenta. (EH) Relative mRNA levels of Il-1β, Il-6, Cxcl1, and Ccl2 in the colon. In this figure, n = 6 for each group. Data are expressed as the mean ± SEM. * p < 0.05, ** p < 0.01, *** p < 0.001 (ANOVA test).
Figure 5
Figure 5
PLR protected the gut and placental barriers in PE mice. (A) Relative mRNA levels of Zo-1 and Occludin in placenta. (B) Serum lipopolysaccharide (LPS) levels were measured by ELISA. (C) Relative mRNA levels of Zo-1, Occludin, and Claudin-1 in the colon. (D) Representative image of ZO-1, Occludin, and Claudin-1 immunohistochemistry staining in colon tissues (original magnification, ×400; scale bar = 50 µm). The average optical densities of ZO-1, Occludin, and Claudin-1 in the colon (E) were measured by Image-Pro Plus software. For (A,C), n = 6 for each group. For (B), n = 7 for each group. For (E), n = 4 for each group. Data are expressed as the mean ± SEM. * p < 0.05, ** p < 0.01, *** p < 0.001 (ANOVA test).
Figure 6
Figure 6
PLR affected the composition of gut microbiota in PE mice. (A) α-Diversity analysis including the observed species, Ace, Chao, Shannon, and Simpson indexes. β-Diversity analysis including the nonmetric multidimensional scaling (NMDS) (B) and heatmap (C) based on the Bray–Curtis diversity distance. (D,E) Relative abundance at the phylum level and genus level. In this figure, n = 7–12 for each group. Data are expressed as the mean ± SEM. * p < 0.05, ** p < 0.01, *** p < 0.001 (Kruskal–Wallis test).
Figure 7
Figure 7
PLR corrected intestinal dysbacteriosis in PE mice. (A) Microbial Dysbiosis index for each group. (B) Comparison of the gut microbiota of mice among the three groups by Turicibacter, Lactobacillus, Anaerotruncus, Bilophila, and Mucispirillum. (C) Biomarkers at the genus level for each group screened based on LDA score. Different colors represent different groups. (D,E) Correlation network of gut microbiota in the PE and PE+PLR d18 groups. (F) Correlation heatmap of differentially abundant microbial genera and representative indicators. Correlations were determined by calculating Spearman’s correlation coefficient. (G) Pathways that were predicted to show significantly different abundances between the PE group and the PE+PLR d18 group according to the Kyoto Encyclopedia of Genes and Genome (KEGG) pathway analysis. In this figure, n = 7–12 for each group. Data are expressed as the mean ± SEM. * p < 0.05, ** p < 0.01, *** p < 0.001 (Kruskal–Wallis test).
Figure 8
Figure 8
Transplantation of feces from mice treated with PLR improved symptoms of PE in mice. (A) The schematic diagram of the experimental design and procedure. (B) The SBP of three groups was measured non-invasively. a indicates p < 0.05 and aaa indicates p < 0.001 for the PE+PLR d18 group versus the PE group on the corresponding day. bb indicates p < 0.01 and bbb indicates p < 0.001 for the PE+PLR-FMT group versus the PE group on the corresponding day. (C) The 24 h proteinuria on GD18. (D) Number of pups per litter. (E) Fetal weight and placental weight in different groups. (F) Representative images of H&E-stained midsagittal placental tissue sections used in histomorphological analysis (original magnification, ×25; scale bar, 1 mm). Zones are marked and indicated by labyrinth zone and junctional zone. For (AE), n = 7 for each group. For (F), n = 6 for each group. Data are expressed as the mean ± SEM. * p < 0.05, ** p < 0.01 (ANOVA test).
Figure 9
Figure 9
FMT altered the composition of gut microbiota in PE mice. (A,B) Comparison of α-Diversity in the PE group and the PE+PLR-FMT group. (C,D) Comparison of α-Diversity in the PE+PLR d18 group and the PE+PLR-FMT group. (EH) Relative abundances of Bilophila, Ruminiclostridium_5, Blautia, and Turicibacter between the PE group and the PE+PLR-FMT group. (I) Correlation heatmap of differentially abundant microbial genera and representative indicators. In this figure, n = 6–8 for each group. Data are expressed as the mean ± SEM. * p < 0.05, ** p < 0.01 (Wilcoxon rank–sum test).

References

    1. Huang L., Cai M., Li L., Zhang X., Xu Y., Xiao J., Huang Q., Luo G., Zeng Z., Jin C., et al. Gut microbiota changes in preeclampsia, abnormal placental growth and healthy pregnant women. BMC Microbiol. 2021;21:265. doi: 10.1186/s12866-021-02327-7. - DOI - PMC - PubMed
    1. Rana S., Lemoine E., Granger J.P., Karumanchi S.A. Preeclampsia: Pathophysiology, challenges, and perspectives. Circ. Res. 2019;124:1094–1112. doi: 10.1161/CIRCRESAHA.118.313276. - DOI - PubMed
    1. Mol B.W.J., Roberts C.T., Thangaratinam S., Magee L.A., de Groot C.J.M., Hofmeyr G.J. Pre-eclampsia. Lancet. 2016;387:999–1011. doi: 10.1016/S0140-6736(15)00070-7. - DOI - PubMed
    1. Brown M.A., Magee L.A., Kenny L.C., Karumanchi S.A., McCarthy F., Saito S., Hall D.R., Warren C.E., Adoyi G., Ishaku S. Hypertensive Disorders of Pregnancy: ISSHP Classification, Diagnosis, and Management Recommendations for International Practice. Hypertension. 2018;72:24–43. doi: 10.1161/HYPERTENSIONAHA.117.10803. - DOI - PubMed
    1. Hooijschuur M.C.E., Ghossein-Doha C., Kroon A.A., De Leeuw P.W., Zandbergen A.A.M., Van Kuijk S.M.J., Spaanderman M.E.A. Metabolic syndrome and pre-eclampsia. Ultrasound Obstet. Gynecol. 2019;54:64–71. doi: 10.1002/uog.20126. - DOI - PubMed

LinkOut - more resources