

Use of Fourier Series in X-ray Diffraction (XRD) Analysis and Fourier-Transform Infrared Spectroscopy (FTIR) for Estimation of Crystallinity in Cellulose from Different Sources
- PMID: 36501592
- PMCID: PMC9736003
- DOI: 10.3390/polym14235199
Use of Fourier Series in X-ray Diffraction (XRD) Analysis and Fourier-Transform Infrared Spectroscopy (FTIR) for Estimation of Crystallinity in Cellulose from Different Sources
Abstract
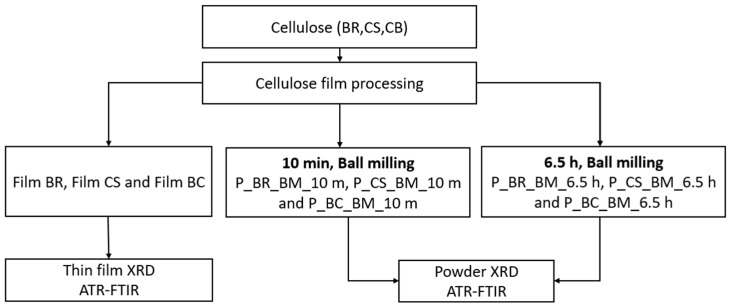
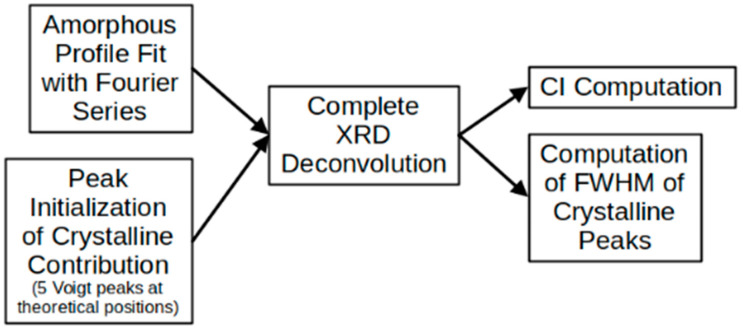
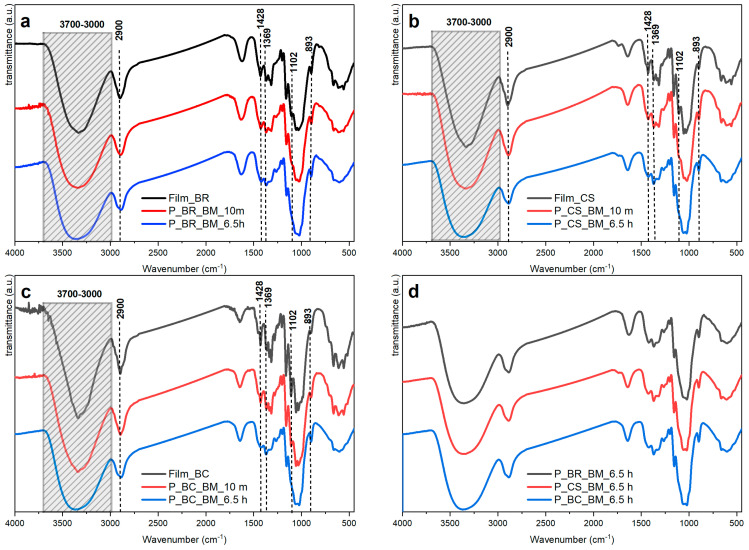
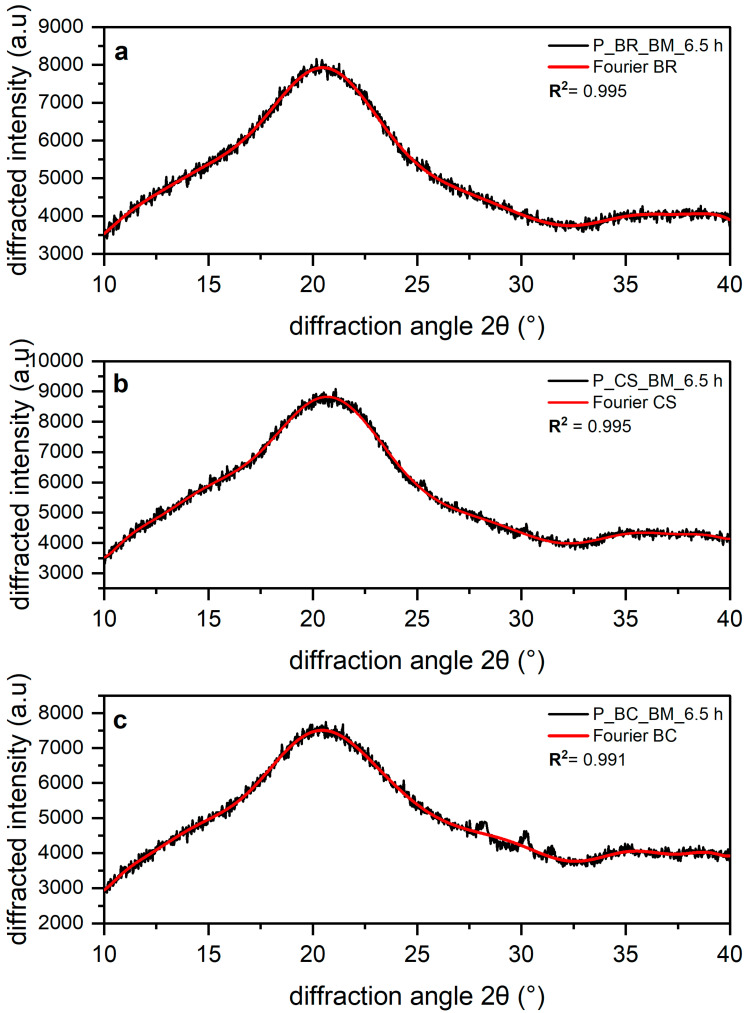
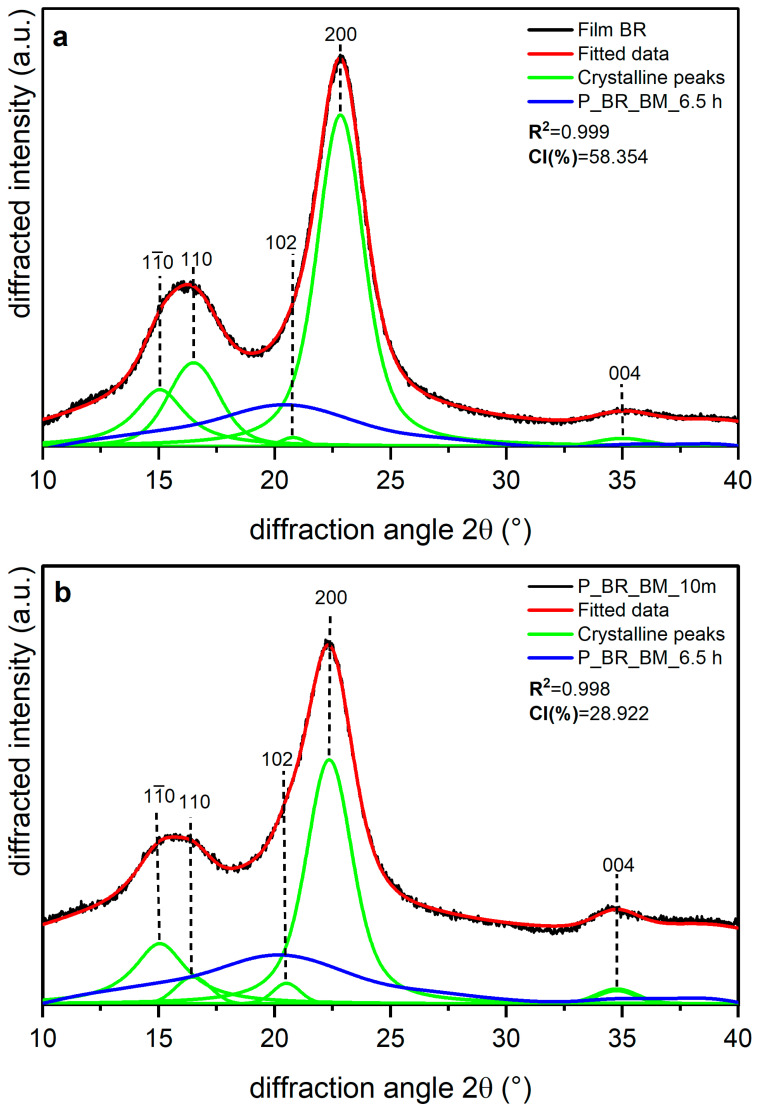
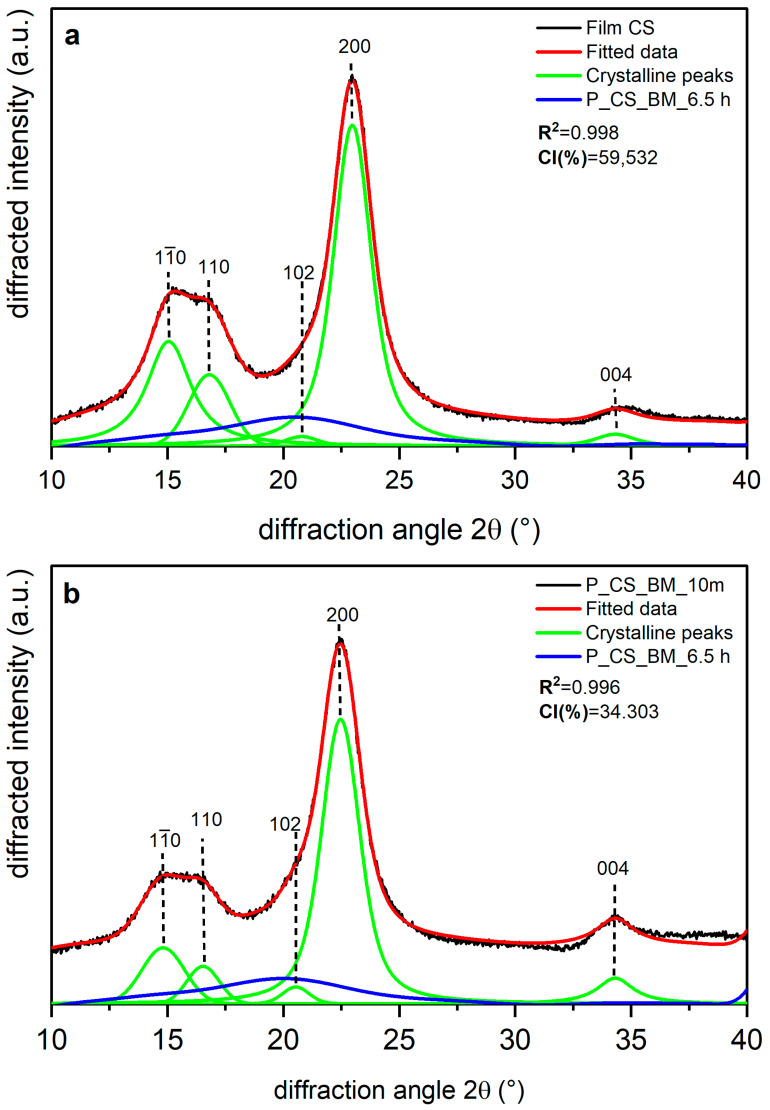
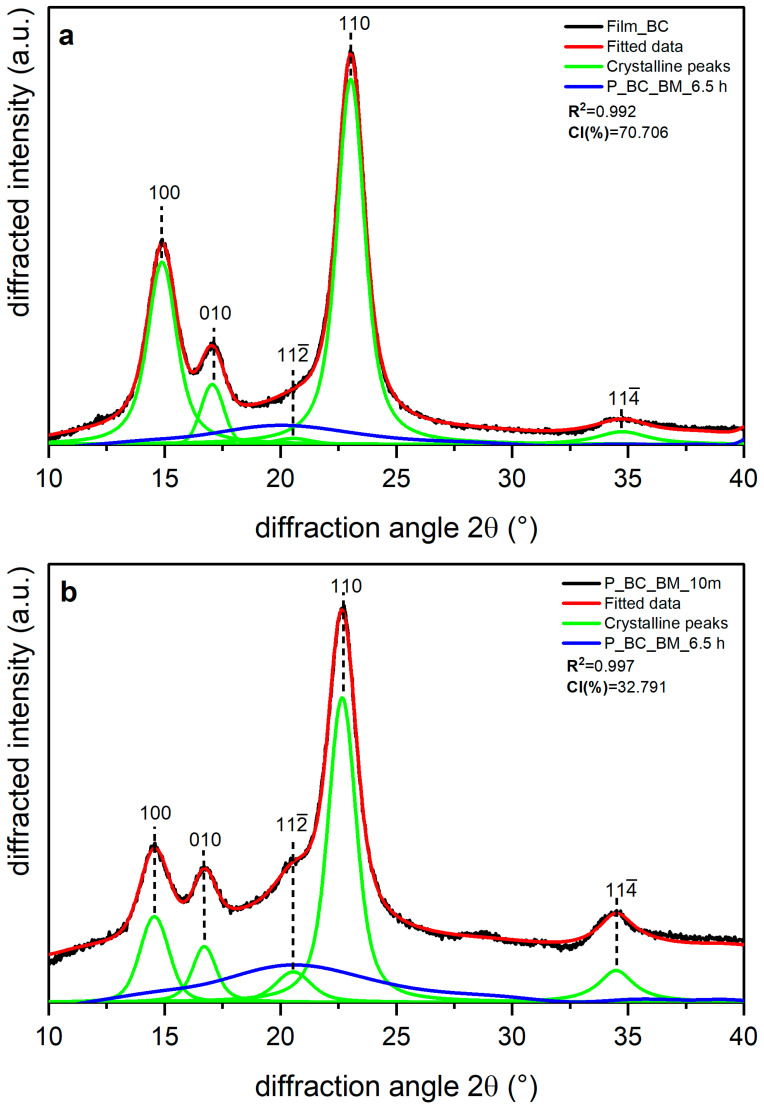
Cellulose crystallinity can be described according to the crystal size and the crystallinity index (CI). In this research, using Fourier-transform infrared spectroscopy (FTIR) and X-ray diffraction (XRD) methods, we studied the crystallinity of three different types of cellulose: banana rachis (BR), commercial cellulose (CS), and bacterial cellulose (BC). For each type of cellulose, we analyzed three different crystallization grades. These variations were obtained using three milling conditions: 6.5 h, 10 min, and unmilled (films). We developed a code in MATLAB software to perform deconvolution of the XRD data to estimate CI and full width at half-maximum (FWHM). For deconvolution, crystalline peaks were represented with Voigt functions, and a Fourier series fitted to the amorphous profile was used as the amorphous contribution, which allowed the contribution of the amorphous profile to be more effectively modeled. Comparisons based on the FTIR spectra and XRD results showed there were no compositional differences between the amorphous samples. However, changes associated with crystallinity were observed when the milling time was 10 min. The obtained CI (%) values show agreement with values reported in the literature and confirm the effectiveness of the method used in this work in predicting the crystallization aspects of cellulose samples.
Keywords: Fourier series; X-ray diffraction; cellulose; crystallinity; crystallinity index; infrared spectroscopy; peak deconvolution.
Conflict of interest statement
The authors report no conflict of interest in performing and publishing this work.
Figures
References
-
- Rojas O., editor. Cellulose Chemistry and Properties: Fibers, Nanocelluloses and Advanced Materials. Springer; New York, NY, USA: 2016.
-
- Ahvenainen P., Kontro I., Svedström K. Comparison of sample crystallinity determination methods by X-ray diffraction for challenging cellulose I materials. Cellulose. 2016;23:1073–1086. doi: 10.1007/s10570-016-0881-6. - DOI
-
- Nelson M.L. Relation of certain infrared bands to cellulose crystallinity and crystal lattice type. Part II. A new infrared ratio for estimation of crystallinity in celluloses I and II. J. Appl. Polym. Sci. 1964;8:1325–1341. doi: 10.1002/app.1964.070080323. - DOI
Grants and funding
LinkOut - more resources
Full Text Sources
