. 2022 Nov 28;22(23):9248.
doi: 10.3390/s22239248.

Properties of Gd-Doped Sol-Gel Silica Glass Radioluminescence under Electron Beams

Affiliations

Properties of Gd-Doped Sol-Gel Silica Glass Radioluminescence under Electron Beams

Daniel Söderström et al. Sensors (Basel). .

Abstract

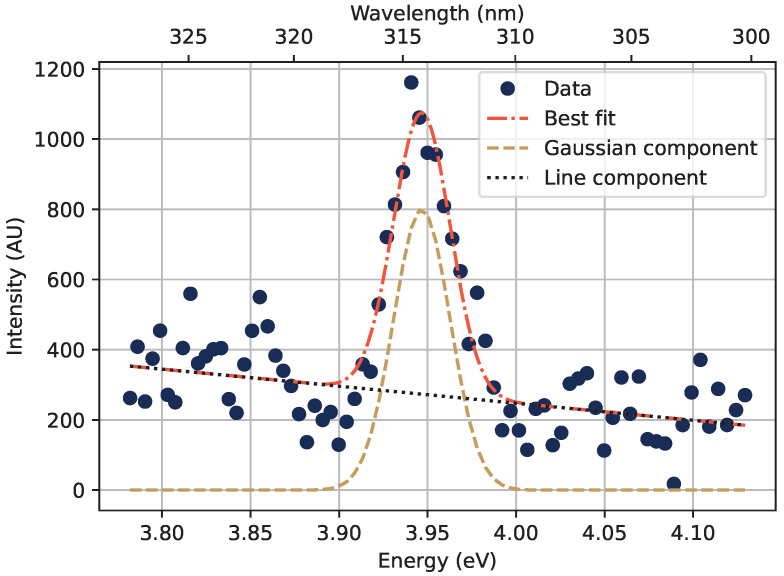
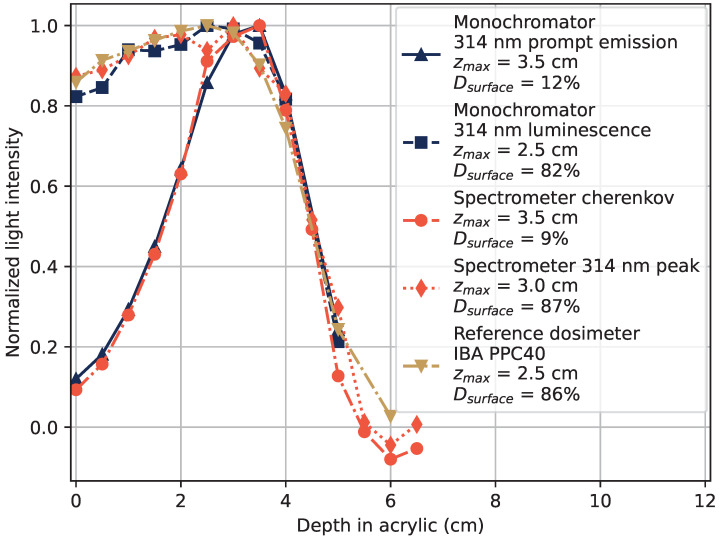
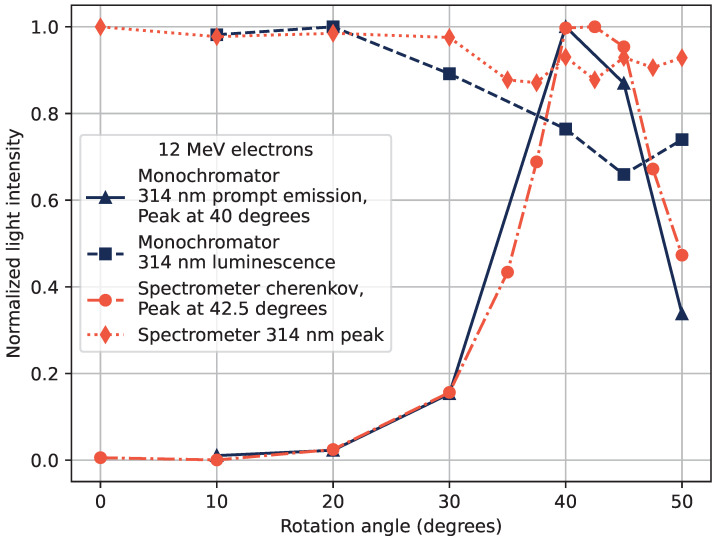
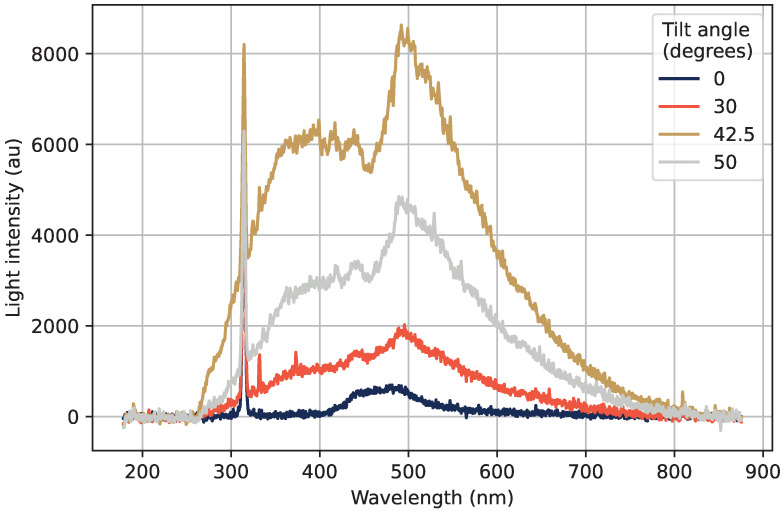
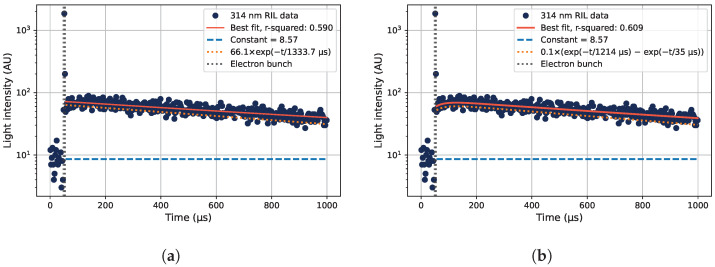
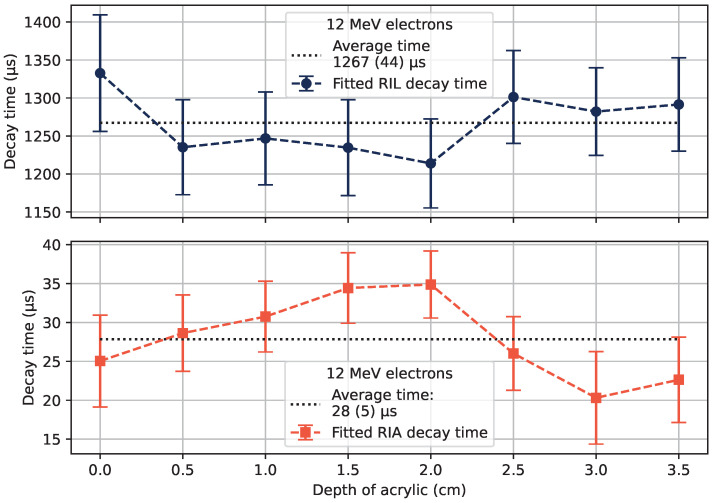
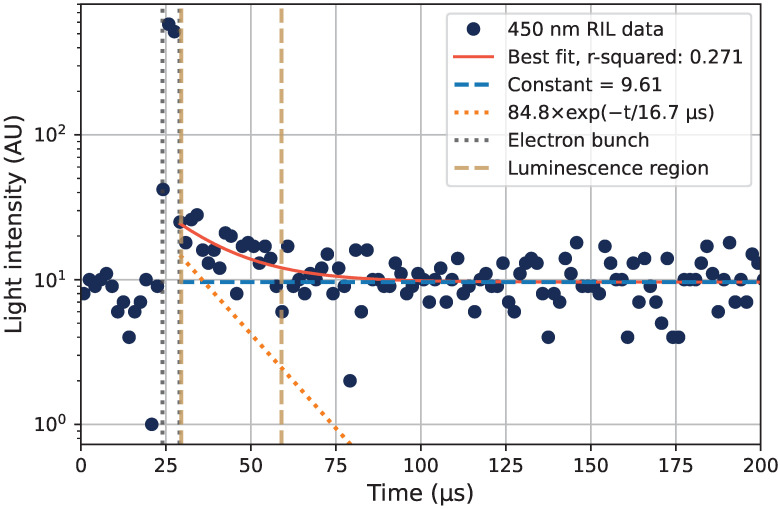
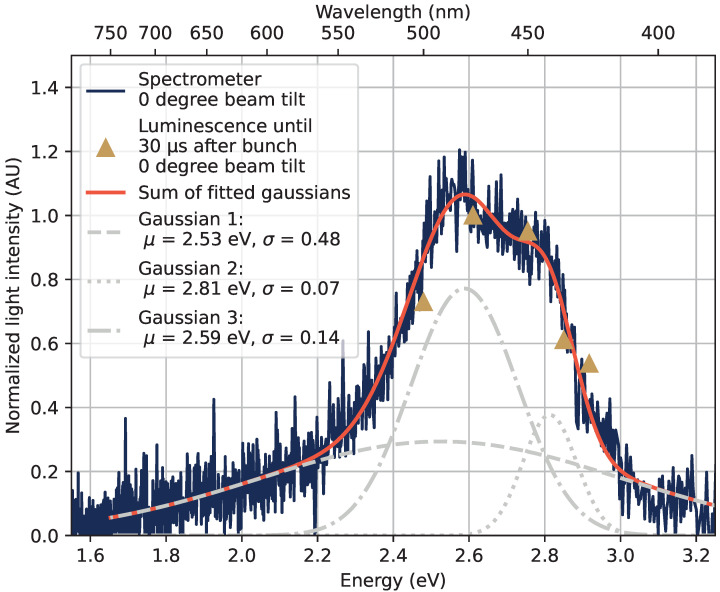
The radiation-induced emission (RIE) of Gd3+-doped sol-gel silica glass has been shown to have suitable properties for use in the dosimetry of beams of ionizing radiation in applications such as radiotherapy. Linear electron accelerators are commonly used as clinical radiotherapy beams, and in this paper, the RIE properties were investigated under electron irradiation. A monochromator setup was used to investigate the light properties in selected narrow wavelength regions, and a spectrometer setup was used to measure the optical emission spectra in various test configurations. The RIE output as a function of depth in acrylic was measured and compared with a reference dosimeter system for various electron energies, since the dose-depth measuring abilities of dosimeters in radiotherapy is of key interest. The intensity of the main radiation-induced luminescence (RIL) of the Gd3+-ions at 314 nm was found to well represent the dose as a function of depth, and was possible to separate from the Cherenkov light that was also induced in the measurement setup. After an initial suppression of the luminescence following the electron bunch, which is ascribed to a transient radiation-induced attenuation from self-trapped excitons (STEX), the 314 nm component was found to have a decay time of approximately 1.3 ms. An additional luminescence was also observed in the region 400 nm to 600 nm originating from the decay of the STEX centers, likely exhibiting an increasing luminescence with a dose history in the tested sample.

Keywords: dosimetry; electron accelerator; optical fiber; point dosimeter; pulsed electron beam; radiation-induced attenuation; radiation-induced luminescence.


Conflict of interest statement

The authors declare no conflict of interest.

Figures

Figure 1
Figure 1
Schematic view of the beam tilting procedure. (a) View from the side, where ϕ is the tilting angle of the beam, and the sample with the transport fiber is marked by the horizontal black line ending in a dashed line. (b) View from the top, with the sample laying in the center of the beam window marked in orange, and the transport fiber directed to the left of the figure along the black dashed line. The beam tilting direction is towards the right.
Figure 2
Figure 2
Examples of the time structure of the radiation-induced emission (RIE), as detected at different wavelengths under irradiation by a pulsed 20 MeV electron beam. (a) The radiation-induced luminescence (RIL) of the Gd3+-ions at 314 nm, along with the prompt radiation response during the electron bunch, marked with orange lines around 50 μs into the collected digitized data traces. (b) Detected photons at 300 nm, consisting of a prompt response but no visible RIL component.
Figure 3
Figure 3
RIE spectra from 20 MeV electrons at a normal incidence angle without any water equivalent material above the sample. The luminescence detected after the electron bunches is shown in blue, and the prompt radiation response during the electron bunch in orange.
Figure 4
Figure 4
Generated light intensity in the sample as a function of depth in acrylic at 314 nm. The RIL after the electron pulse (squares) and the prompt light signal (triangles) were separated as in Figure 3. The response of a reference dosimeter, an IBA PPC40, is included in the figures as a gold dash-dotted line. The figure legends display the depth at which the maximal dose was recorded, zmax, and the surface dose (0 cm depth) fraction relative to the maximum dose as Dsurface. (a) 20 MeV electron beam. (b) 6 MeV electron beam.
Figure 5
Figure 5
The wavelength region with the 314 nm emission peak from the Gd3+-ions as measured under 4 cm acrylic and 12 MeV electrons. The emission peak was approximated as a Gaussian over the Cherenkov radiation background, which in turn was approximated with a straight line in the region shown in the figure.
Figure 6
Figure 6
Dose–depth curves in acrylic of 12 MeV electrons obtained with the digitized PMT signal and monochromator set to 314 nm as shown in blue, using optical spectrometer in orange, and IBA PPC40 dosimeter in gold.
Figure 7
Figure 7
Detected light intensity as a function of the beam tilting angle of a 12 MeV electron beam obtained with digitized PMT signal and monochromator set to 314 nm shown in blue, and with optical spectrometer shown in orange.
Figure 8
Figure 8
Emission spectra at different tilt angles, with the sharp emission peak of Gd3+ at 314 nm, as well as a wide Cherenkov emission spectrum with a maximum intensity at 42.5°.
Figure 9
Figure 9
Measured decay curves of the 314 nm RIL of the Gd3+-doped sample, using 12 MeV electrons at a depth of 2 cm in acrylic. The time of the electron pulse is also shown. (a) Data fitted to one exponential decay component (orange dotted line) plus a constant representing the background level (blue dashed line), according to Equation (2). (b) The data fitted with one exponential decay component with an additional term to account for the initial increase in light emission intensity over time shortly after the electron bunch, described in Equation (3).
Figure 10
Figure 10
Fitted luminescence decay times (top), and transient RIA decay (luminescence buildup) times (bottom) at different depths of acrylic for 12 MeV electrons, with the estimated standard deviation of the fitted variable value as the error bars. The average of the measured values is shown with dotted lines, with the estimated standard deviations of the averages in parentheses.
Figure 11
Figure 11
Luminescence decay measured at 450 nm, relative to the electron bunch time. The data were fitted to one exponential decay (orange-dotted line) plus a constant representing the background level (blue-dashed line), as given by Equation (2).
Figure 12
Figure 12
The observed peak in the optical emission spectrum between 400 nm and 600 nm. The structure is reproduced with an optical spectrometer as the blue line, and by summing the detected photons in the luminescence time region marked in Figure 11 by gold-dashed lines, resulting in the points marked by gold triangles in this figure. The spectrometer measurement was also fitted to a sum of three Gaussian components to recreate the peak shape.

References

    1. El Hamzaoui H., Bouwmans G., Capoen B., Cassez A., Habert R., Ouerdane Y., Girard S., Di Francesca D., Kerboub N., Morana A., et al. Gd3+-doped sol-gel silica glass for remote ionizing radiation dosimetry. OSA Contin. 2019;2:715–721. doi: 10.1364/OSAC.2.000715. - DOI
    1. Hoehr C., Morana A., Duhamel O., Capoen B., Trinczek M., Paillet P., Duzenli C., Bouazaoui M., Bouwmans G., Cassez A., et al. Novel Gd3+-doped silica-based optical fiber material for dosimetry in proton therapy. Sci. Rep. 2019;9:16376. doi: 10.1038/s41598-019-52608-5. - DOI - PMC - PubMed
    1. Söderström D., Kettunen H., Morana A., Javanainen A., Ouerdane Y., El Hamzaoui H., Capoen B., Bouwmans G., Bouazaoui M., Girard S. Radioluminescence Response of Ce-, Cu-, and Gd-Doped Silica Glasses for Dosimetry of Pulsed Electron Beams. Sensors. 2021;21:7523. doi: 10.3390/s21227523. - DOI - PMC - PubMed
    1. He J., Wang Y., Steigenberger S., Macpherson A., Chiodini N., Brambilla G. Intense ultraviolet photoluminescence at 314 nm in Gd3+-doped silica; Proceedings of the Conference on Lasers and Electro-Optics: Applications and Technology 2016. Optical Society of America; San Jose, CA, USA. 5–10 June 2016; p. JTh2A.86. - DOI
    1. Di Martino D., Chiodini N., Fasoli M., Moretti F., Vedda A., Baraldi A., Buffagni E., Capelletti R., Mazzera M., Nikl M., et al. Gd-incorporation and luminescence properties in sol–gel silica glasses. J. Non-Cryst. Sol. 2008;354:3817–3823. doi: 10.1016/j.jnoncrysol.2008.05.027. - DOI

LinkOut - more resources