Validity of Two Consumer Multisport Activity Tracker and One Accelerometer against Polysomnography for Measuring Sleep Parameters and Vital Data in a Laboratory Setting in Sleep Patients
- PMID: 36502241
- PMCID: PMC9741062
- DOI: 10.3390/s22239540
Validity of Two Consumer Multisport Activity Tracker and One Accelerometer against Polysomnography for Measuring Sleep Parameters and Vital Data in a Laboratory Setting in Sleep Patients
Abstract
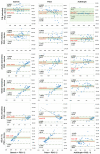
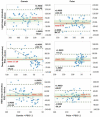
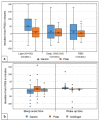
Two commercial multisport activity trackers (Garmin Forerunner 945 and Polar Ignite) and the accelerometer ActiGraph GT9X were evaluated in measuring vital data, sleep stages and sleep/wake patterns against polysomnography (PSG). Forty-nine adult patients with suspected sleep disorders (30 males/19 females) completed a one-night PSG sleep examination followed by a multiple sleep latency test (MSLT). Sleep parameters, time in bed (TIB), total sleep time (TST), wake after sleep onset (WASO), sleep onset latency (SOL), awake time (WASO + SOL), sleep stages (light, deep, REM sleep) and the number of sleep cycles were compared. Both commercial trackers showed high accuracy in measuring vital data (HR, HRV, SpO2, respiratory rate), r > 0.92. For TIB and TST, all three trackers showed medium to high correlation, r > 0.42. Garmin had significant overestimation of TST, with MAE of 84.63 min and MAPE of 25.32%. Polar also had an overestimation of TST, with MAE of 45.08 min and MAPE of 13.80%. ActiGraph GT9X results were inconspicuous. The trackers significantly underestimated awake times (WASO + SOL) with weak correlation, r = 0.11−0.57. The highest MAE was 50.35 min and the highest MAPE was 83.02% for WASO for Garmin and ActiGraph GT9X; Polar had the highest MAE of 21.17 min and the highest MAPE of 141.61% for SOL. Garmin showed significant deviations for sleep stages (p < 0.045), while Polar only showed significant deviations for sleep cycle (p = 0.000), r < 0.50. Garmin and Polar overestimated light sleep and underestimated deep sleep, Garmin significantly, with MAE up to 64.94 min and MAPE up to 116.50%. Both commercial trackers Garmin and Polar did not detect any daytime sleep at all during the MSLT test. The use of the multisport activity trackers for sleep analysis can only be recommended for general daily use and for research purposes. If precise data on sleep stages and parameters are required, their use is limited. The accuracy of the vital data measurement was adequate. Further studies are needed to evaluate their use for medical purposes, inside and outside of the sleep laboratory. The accelerometer ActiGraph GT9X showed overall suitable accuracy in detecting sleep/wake patterns.
Keywords: actigraphy; mHealth; polysomnography; self-tracking; sleep; validity; wearables.
Conflict of interest statement
The authors declare no conflict of interest.
Figures


Similar articles
-
Validity Evaluation of the Fitbit Charge2 and the Garmin vivosmart HR+ in Free-Living Environments in an Older Adult Cohort.JMIR Mhealth Uhealth. 2019 Jun 19;7(6):e13084. doi: 10.2196/13084. JMIR Mhealth Uhealth. 2019. PMID: 31219048 Free PMC article.
-
Validity, potential clinical utility, and comparison of consumer and research-grade activity trackers in Insomnia Disorder I: In-lab validation against polysomnography.J Sleep Res. 2020 Feb;29(1):e12931. doi: 10.1111/jsr.12931. Epub 2019 Oct 18. J Sleep Res. 2020. PMID: 31626361
-
The Sleep of the Ring: Comparison of the ŌURA Sleep Tracker Against Polysomnography.Behav Sleep Med. 2019 Mar-Apr;17(2):124-136. doi: 10.1080/15402002.2017.1300587. Epub 2017 Mar 21. Behav Sleep Med. 2019. PMID: 28323455 Free PMC article.
-
Accuracy of Wristband Fitbit Models in Assessing Sleep: Systematic Review and Meta-Analysis.J Med Internet Res. 2019 Nov 28;21(11):e16273. doi: 10.2196/16273. J Med Internet Res. 2019. PMID: 31778122 Free PMC article.
-
Sleep Behaviour in Sickle Cell Disease: A Systematic Review and Meta-Analysis.Children (Basel). 2024 Dec 26;12(1):21. doi: 10.3390/children12010021. Children (Basel). 2024. PMID: 39857852 Free PMC article. Review.
Cited by
-
Characteristics of macroscopic sleep structure in patients with mild cognitive impairment: a systematic review.Front Psychiatry. 2023 Jul 20;14:1212514. doi: 10.3389/fpsyt.2023.1212514. eCollection 2023. Front Psychiatry. 2023. PMID: 37547222 Free PMC article.
-
Performance Evaluation of a New Sport Watch in Sleep Tracking: A Comparison against Overnight Polysomnography in Young Adults.Sensors (Basel). 2024 Mar 30;24(7):2218. doi: 10.3390/s24072218. Sensors (Basel). 2024. PMID: 38610432 Free PMC article.
-
Validation of nocturnal resting heart rate and heart rate variability in consumer wearables.Physiol Rep. 2025 Aug;13(16):e70527. doi: 10.14814/phy2.70527. Physiol Rep. 2025. PMID: 40834291 Free PMC article.
-
Validation of a Neurophysiological-Based Wearable Device (Somfit) for the Assessment of Sleep in Athletes.Sensors (Basel). 2025 Mar 27;25(7):2123. doi: 10.3390/s25072123. Sensors (Basel). 2025. PMID: 40218633 Free PMC article.
-
Mindful Self-Compassion to Reduce Pain Interference Among Adults with Osteogenesis Imperfecta.J Clin Psychol Med Settings. 2025 Aug 14. doi: 10.1007/s10880-025-10092-2. Online ahead of print. J Clin Psychol Med Settings. 2025. PMID: 40813548
References
-
- Düking P., Giessing L., Frenkel M.O., Koehler K., Holmberg H.-C., Sperlich B. Wrist-Worn Wearables for Monitoring Heart Rate and Energy Expenditure While Sitting or Performing Light-to-Vigorous Physical Activity: Validation Study. JMIR Mhealth Uhealth. 2020;8:e16716. doi: 10.2196/16716. - DOI - PMC - PubMed
-
- Laricchia F. Fitness Trackers—Statistics & Facts. [(accessed on 17 November 2022)]. Available online: https://www.statista.com/topics/4393/fitness-and-activity-tracker/#topic....
MeSH terms
LinkOut - more resources
Full Text Sources

