Review
. 2023 Oct 24;19(20):6891-6932.
doi: 10.1021/acs.jctc.2c00958. Epub 2022 Dec 11.

CRYSTAL23: A Program for Computational Solid State Physics and Chemistry

Affiliations
Review

CRYSTAL23: A Program for Computational Solid State Physics and Chemistry

Alessandro Erba et al. J Chem Theory Comput. .

Abstract

The Crystal program for quantum-mechanical simulations of materials has been bridging the realm of molecular quantum chemistry to the realm of solid state physics for many years, since its first public version released back in 1988. This peculiarity stems from the use of atom-centered basis functions within a linear combination of atomic orbitals (LCAO) approach and from the corresponding efficiency in the evaluation of the exact Fock exchange series. In particular, this has led to the implementation of a rich variety of hybrid density functional approximations since 1998. Nowadays, it is acknowledged by a broad community of solid state chemists and physicists that the inclusion of a fraction of Fock exchange in the exchange-correlation potential of the density functional theory is key to a better description of many properties of materials (electronic, magnetic, mechanical, spintronic, lattice-dynamical, etc.). Here, the main developments made to the program in the last five years (i.e., since the previous release, Crystal17) are presented and some of their most noteworthy applications reviewed.


Conflict of interest statement

The authors declare no competing financial interest.

Figures

Figure 1
Figure 1
Availability of relativistic effective small core (SC) and large core (LC) potentials, as well as potentials for super heavy (SH) elements, including AREP and SOREP operators, for calculations with spin–orbit coupling and associated keywords from the Crystal input.
Figure 2
Figure 2
Electronic band structures of W-dichalcogenide monolayers for (A, B) WSe2 with the PBE and PBE0 functionals (C, D) WTe2 with the PBE and PBE0 functionals. (E, F) PBE0 z component spin-current densities (I) 2D W-dichalcogenide structure. (G, H) z component spin-current density differences with respect to second variational values for PBE (center panel) and PBE0 (rightmost panel) xc functionals.
Figure 3
Figure 3
(A) Crystal structure of the I41md tetragonal phase of TaAs. (B) Effect of SOC on the valence band structure. (C) Orbital-relaxation contribution to the spin-current densities ΔJi = JfinaliJinitiali, with differences taken with respect to second variational values in the DFT (upper panels) and SCDFT (lower panels). (D) Splitting by SOC of the Dirac-like node into Weyl node pairs in the DFT and SCDFT and comparison with ARPES experimental values.
Figure 4
Figure 4
GGA (top panels) collinear and (bottom panels) noncollinear magnetization densities of the I2+ molecule, as it is rotated from the x axis to the z axis. Energy differences ΔE (in Hartree) with respect to the z-oriented molecule are also provided. The color intensity represents the magnitude formula image, while the arrow length and direction represent the in-plane components mx and mz.
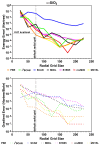
Figure 5
Figure 5
Error on the calculation of the electronic total energy (top) and the gradient norm (bottom) for α-quartz obtained by using different radial grid sizes at a fixed angular grid as evaluated for both GGA and mGGA functionals.
Figure 6
Figure 6
Comparison between computed and experimental lattice parameters for the 28 cubic crystals as per the newly implemented mGGA DFAs.
Figure 7
Figure 7
Comparison between computed and experimental bulk moduli for the 28 cubic crystals as per the newly implemented mGGA DFAs.
Figure 8
Figure 8
Comparison between computed and experimental band gaps for the 28 cubic crystals as per the newly implemented mGGA DFAs.
Figure 9
Figure 9
Example of revision of the def2-mSVP basis set: d exponents for the elements of the fourth row before (gray and blue lines) and after (yellow and orange lines) the basis set revision. d1 is the exponent in the inner Gaussian function, while d2 is the one of the outermost one.
Figure 10
Figure 10
Comparison between the original 3c composite methods (a) and the revised sol-3c ones (b).
Figure 11
Figure 11
Computational efficiency of the different sets of routines for calculating the E RSSH-GTF pair coefficients of eq 60 for the total energy. The blue shapes represent timings for the oldest series of routines for calculating s-s, s-p, s-d, p-s, ..., d-d coefficients. The green triangles are for the f-s, f-p, ..., f-f coefficient routines introduced in Crystal03. The red dots are for the new g-s, g-p, ..., g-g coefficient routines of Crystal23.
Figure 12
Figure 12
Speedups for calculating s-s, s-p,···, p-s, p-p,···, d-d RSSH-GTF pair Gax, Gay, and Gaz coefficients with the new routines in Crystal23 vs the previously existing routines.
Figure 13
Figure 13
Atomic structure of (A) the tetraphenyl phosphate uranium hexafluoride crystal, [PPh4+][UF6]; (B) the cesium uranyl chloride crystal, Cs2UO2Cl4; and (C) the UCl4 crystal. (D) Spatial distribution of the VSCC critical points of the Laplacian of the density ∇2ρ(r) around the U atom of the [PPh4+][UF6] crystal in the calculations (left) and in the experiments (right). A zoomed-in view in the vicinity of the U atom is also shown. (E) Deformation density, Δρ(r), contour maps of the cesium uranyl chloride crystal around the U atom in two different planes: (left) through the O–U–O axis and the b crystal lattice vector and (right) the equatorial plane of the four Cl atoms. Contour values are ±0.05, 0.15, 0.25, 0.4, 0.7, 1.0, 1.5, 2.0 e–3. Red and blue lines correspond to positive and negative values, respectively. (F) Distribution of L(r) around the U atom in a 3D representation where isosurfaces of ±0.4 e/Bohr5 are shown (yellow for positive, blue for negative) for the frozen molecular fragment UCl4 (left) and for the periodic UCl4 crystal (right). (G) Deformation density, Δρ(r), contour maps of the frozen molecule (left) and of the crystal (right) on a plane passing through two U–Clfnn and two U–Clsnn. Bond critical points are marked by small black circles. The atomic structure of the crystal in the selected plane is superimposed in the right panel to help the interpretation of the plots.
Figure 14
Figure 14
Schematic representation of what new consistent local basis sets are available in Crystal23 for what elements of the periodic table.
Figure 15
Figure 15
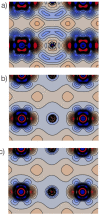
Dual basis set perturbative approach, NaCl solid. Difference charge density maps are shown in (a, b, c) for zeroth, first, and second perturbative orders, respectively. The difference is computed with respect to the charge density of the reference large basis set. Details as in Table 5. Isoline spacing is set to 10 μBohr.
Figure 16
Figure 16
(a–d) 2D grid of points defining the nuclear configurations that need to be considered in the evaluation of the adiabatic PES in its 2M4T representation for the four different numerical schemes implemented. Different colors correspond to different quantities computed for each nuclear configuration: only energy (green), energy and forces (blue), and energy, forces, and Hessian (red). (e) Simulated infrared spectrum of the low-temperature Co Ad-layer on MgO (001) from quantum-mechanical calculations and graphical representation of the normal modes of vibration associated with the three intense peaks (arrows of the same color correspond to in-phase atomic motions). Δν̃ is the frequency shift with respect to the CO stretching in gas phase. The bottom right inset shows experimental FTIR spectra of CO molecules adsorbed on (001) MgO surfaces, recorded at 60 K, as a function of surface coverage (spectra are vertically offset for clarity) in the spectral region of the fundamental transition for the in-phase stretching motion of all CO molecules (right panel) and of the corresponding first overtone (left panel). (f) Anharmonic coefficient χa = 2ν̃0→1 – ν̃0→2 (in cm–1) of the stretching mode of CO in gas phase and in the low-temperature ordered c(4 × 2) monolayer adsorbed on MgO (001) surfaces. (g) VSCF two-quanta excited-state pair coupling space of ice XI. For each pair (Qi,Qj) of normal modes, ΔωijPD is reported, as defined in eq 98.
Figure 17
Figure 17
Memory usage per core of MPPCrystal for the MCM-41 X16 case as a function of the number cores and threads. All calculations were run on the Archer2 supercomputer.
Figure 18
Figure 18
Performance of MPPCrystal for the MCM-41 X16 case as a function of the number cores and threads. All calculations were run on the Archer2 supercomputer.
Figure 19
Figure 19
3D plots of the spatial distribution of the Young modulus of (top) copper(II) acetylacetonate crystals and (bottom) rubrene crystals, as a function of temperature. For copper(II) acetylacetonate, the value of the Young modulus along two specific directions, [101] and [101], is also reported and compared to room temperature experiments. For rubrene, the 3D plot of the experimental Young modulus at room temperature is reported for comparison. Data are in GPa.,
Figure 20
Figure 20
Selected adiabatic thermoelastic constants of α-Mg2SiO4 forsterite as a function of temperature as measured experimentally (circles) and as computed with our quasi-harmonic models (lines). Panels on the left and right report simulated trends with the simplified quasi-static approach of Section 9.1 and with the more explicit quasi-harmonic one of Section 9.2, respectively.
Figure 21
Figure 21
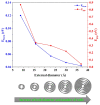
Formation energy, Eform, and band gap, Egap, of carbon zigzag multiwalled nanotubes. From the single wall (11,0) characterized by 44 atoms in the reference cell, 88 symmetry operators, and D = 8.7 Å, to the M = 5 system, (11,0)@(20,0)@(29,0)@(38,0)@(47,0) with 580 atoms, 376 symmetry operators, and D = 37.1 Å.
Figure 22
Figure 22
Transport properties of C@(BN)xC1–xzigzag double-walled nanotubes with different percentages and patterns of doping compared with the corresponding single-walled materials, (BN)xC1–x. Seebeck coefficient (left) and power factor (right). In the two insets: the dependency on temperature of S (left) and PF (right) in the range of chemical potentials corresponding to experimentally measured carrier densities.

References

    1. Hasnip P. J.; Refson K.; Probert M. I.; Yates J. R.; Clark S. J.; Pickard C. J. Density functional theory in the solid state. Philos. Trans. R. Soc. A 2014, 372, 20130270. 10.1098/rsta.2013.0270. - DOI - PMC - PubMed
    1. Curtarolo S.; Hart G. L.; Nardelli M. B.; Mingo N.; Sanvito S.; Levy O. The high-throughput highway to computational materials design. Nat. Mater. 2013, 12, 191–201. 10.1038/nmat3568. - DOI - PubMed
    1. Burke K. Perspective on density functional theory. J. Chem. Phys. 2012, 136, 150901. 10.1063/1.4704546. - DOI - PubMed
    1. Neugebauer J.; Hickel T. Density functional theory in materials science. Wiley Interdiscip. Rev. Comput. Mol. Sci. 2013, 3, 438–448. 10.1002/wcms.1125. - DOI - PMC - PubMed
    1. Hafner J.; Kresse G.. Properties of Complex Inorganic Solids; Springer, 1997; pp 69–82.