

Assessing the relative importance of stressors to the benthic index, M-AMBI: An example from U.S. estuaries
- PMID: 36502776
- PMCID: PMC9813808
- DOI: 10.1016/j.marpolbul.2022.114456
Assessing the relative importance of stressors to the benthic index, M-AMBI: An example from U.S. estuaries
Abstract
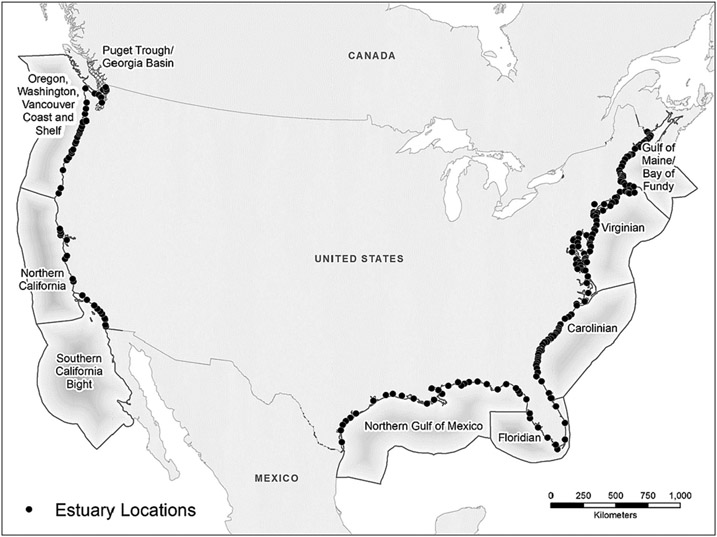
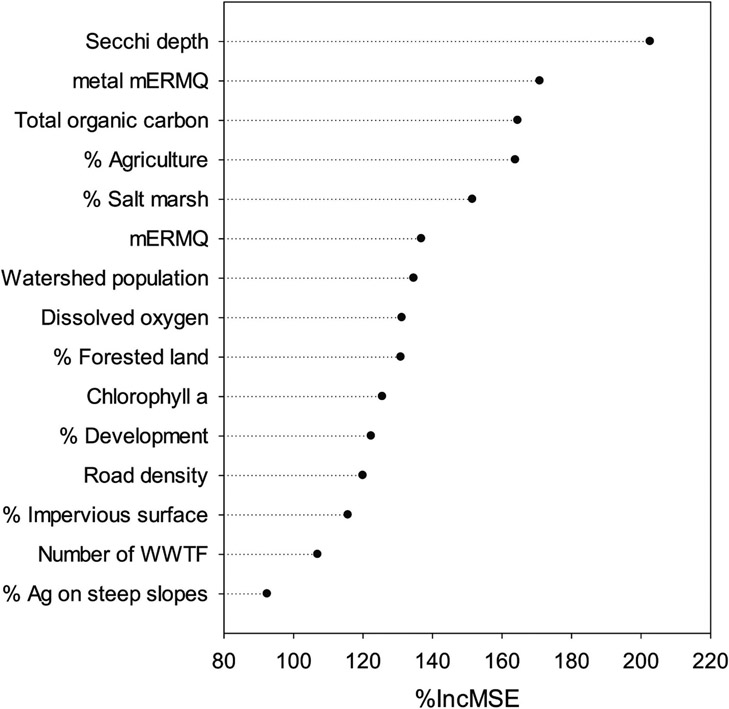
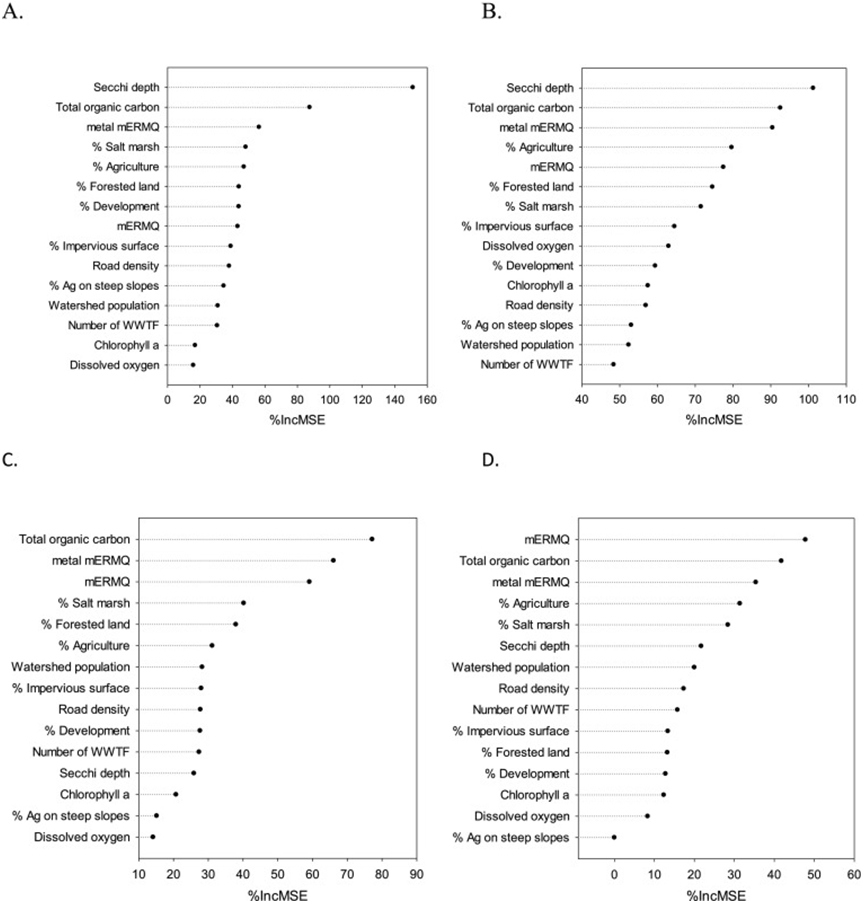
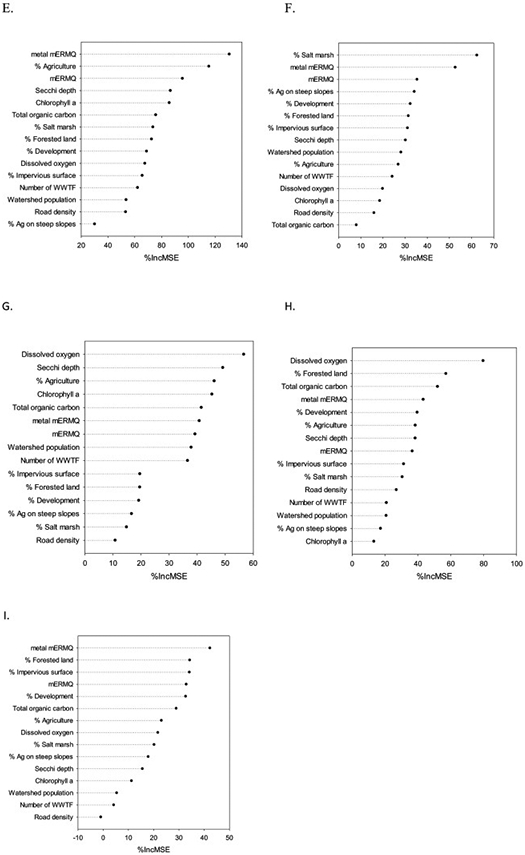
M-AMBI, a multivariate benthic index, has been used by European and American (U.S.) authorities to assess estuarine and coastal health and has been used in scientific studies throughout the world. It has been shown to be related to multiple pressures and stressors, but the relative importance of individual stressors within a multiple stressor context has not generally been assessed. In this study, we assembled data collected between 1999 and 2015 by the U.S. Environmental Protection Agency using consistent methods. These data included sediment and water quality measures and benthic invertebrate data which were used to calculate M-AMBI. We further assembled watersheds for all US estuaries with benthic data and calculated land use metrics. Random forest (RF) was used to identify those variables most strongly related to M-AMBI. Because RF is a compilation of multiple, nonlinear models, we then assessed which of these variables had a direct relationship with M-AMBI. The resulting variables were then assessed using RF to identify the subsets of variables that produced an effective and parsimonious model. This process was conducted at the national and ecoregional scale and the variables identified as being most important to predict M-AMBI were compared with literature reports of ecological patterns in a given area. At the national scale, better condition was correlated with clearer waters, lower amounts of agriculture in the watershed, and lower carbon and metal concentrations in estuarine sediments. Other stressors were identified as being important at the ecoregional scale, although sediment metal concentrations and watershed agriculture were identified as being important in most ecoregions. Our results suggest that this technique is useful to identify the most important variables impacting M-AMBI at broad spatial scales, even when the percentage of sites in Bad or Poor condition is low. This technique also provides an initial identification of important stressors that can be used to target more intensive local studies.
Keywords: Benthic index; M-AMBI; Random forest; Statistics; Stressors.
Published by Elsevier Ltd.
Conflict of interest statement
Declaration of competing interest The authors declare that they have no known competing financial interests or personal relationships that could have appeared to influence the work reported in this paper.
Figures
References
-
- Adl SM, Leander BS, Simpson AGB, Archibald JM, Anderson OR, Bass D, Bowser SS, Brugerolle G, Farmer MA, Karpov S, Kolisko M, Lane CE, Lodge DJ, Mann DG, Meisterfeld R, Mendoza L, Moestrup Ø, Mozley- Standridge SE, Smirnov AV, Spiegel F, Collins T, Sullivan J, 2007. Diversity, nomenclature, and taxonomy of protists. Syst. Biol 56, 684–689. - PubMed
-
- Agrawal AA, Hastings AP, Johnson MTJ, Maron JL, Salminen J-P, 2012. Insect herbivores drive real-time ecological and evolutionary change in plant populations. Science 338, 113–116. - PubMed
-
- Anderson CR, Kudela RM, Kahru M, Chao Y, Rosenfeld LK, Bahr FL, Anderson DM, Norris TA, 2016. Initial skill assessment of the California harmful algae risk mapping (C-HARM) system. Harmful Algae 59, 1–18. - PubMed
MeSH terms
Grants and funding
LinkOut - more resources
Full Text Sources
Research Materials
