. 2022 Dec 12;20(1):585.
doi: 10.1186/s12967-022-03801-0.

Analysis of correlations between gut microbiota, stool short chain fatty acids, calprotectin and cardiometabolic risk factors in postmenopausal women with obesity: a cross-sectional study

Affiliations

Analysis of correlations between gut microbiota, stool short chain fatty acids, calprotectin and cardiometabolic risk factors in postmenopausal women with obesity: a cross-sectional study

Igor Łoniewski et al. J Transl Med. .

Abstract

Background: Microbiota and its metabolites are known to regulate host metabolism. In cross-sectional study conducted in postmenopausal women we aimed to assess whether the microbiota, its metabolites and gut barrier integrity marker are correlated with cardiometabolic risk factors and if microbiota is different between obese and non-obese subjects.

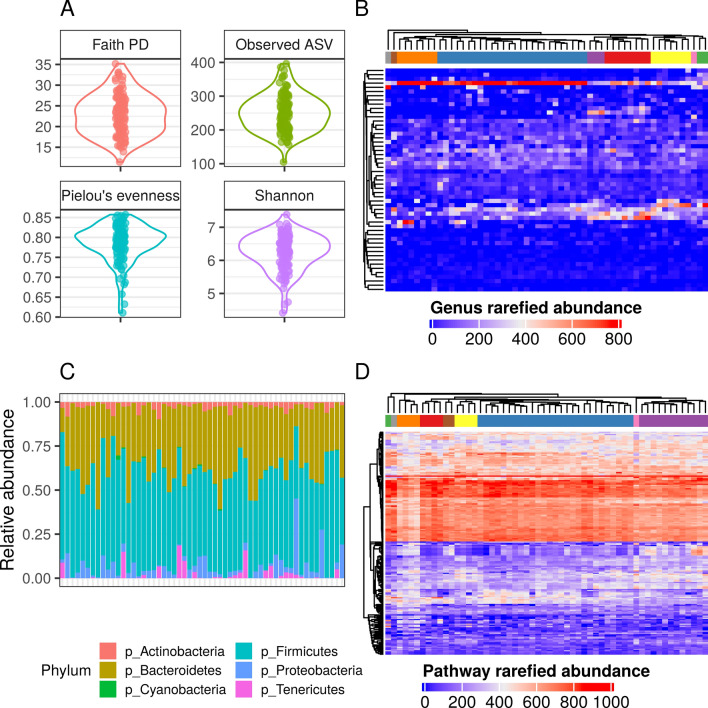
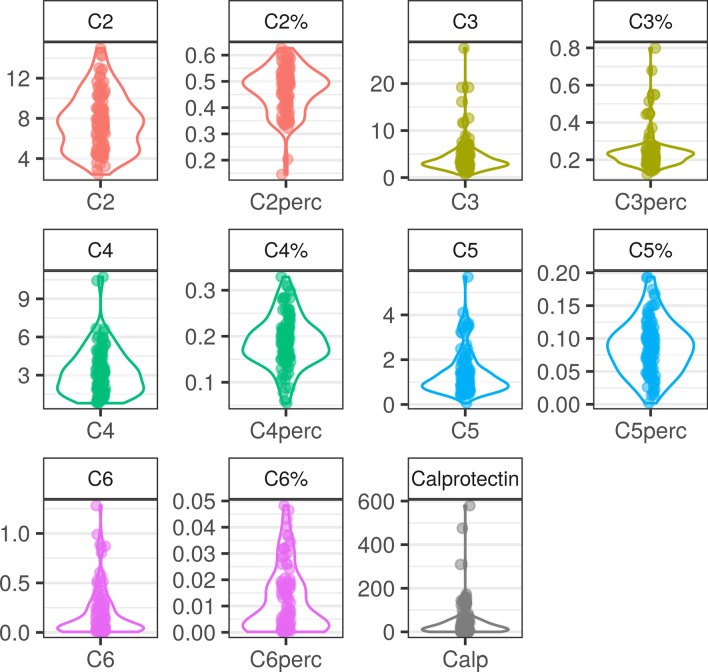
Methods: We analysed the faecal microbiota of 56 obese, postmenopausal women by means of 16S rRNA analysis. Stool short chain fatty acids, calprotectin and anthropometric, physiological and biochemical parameters were correlates to microbiome analyses.

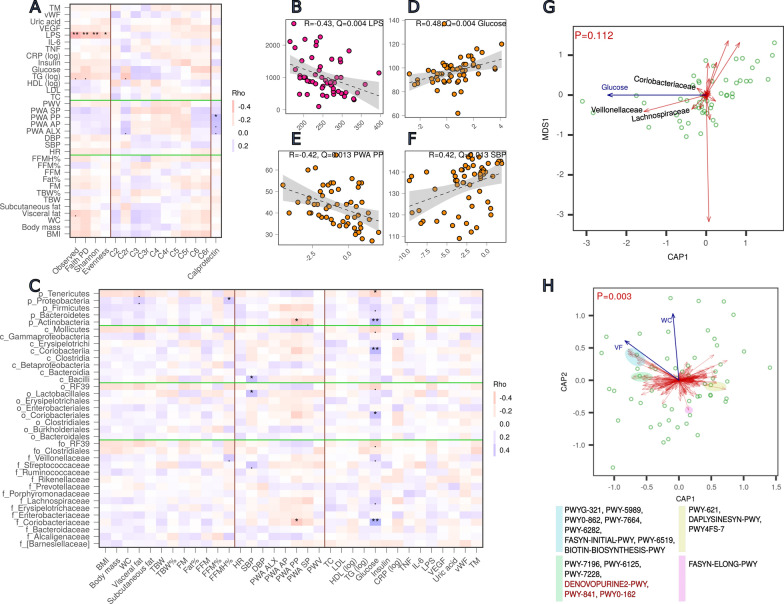
Results: Alpha-diversity was inversely correlated with lipopolysaccharide (Rho = - 0.43, FDR P (Q) = 0.004). Bray-Curtis distance based RDA revealed that visceral fat and waist circumference had a significant impact on metabolic potential (P = 0.003). Plasma glucose was positively correlated with the Coriobacteriaceae (Rho = 0.48, Q = 0.004) and its higher taxonomic ranks, up to phylum (Actinobacteria, Rho = 0.46, Q = 0.004). At the metabolic level, the strongest correlation was observed for the visceral fat (Q < 0.15), especially with the DENOVOPURINE2-PWY, PWY-841 and PWY0-162 pathways. Bacterial abundance was correlated with SCFAs, thus some microbiota-glucose relationships may be mediated by propionate, as indicated by the significant average causal mediation effect (ACME): Lachnospiraceae (ACME 1.25, 95%CI (0.10, 2.97), Firmicutes (ACME 1.28, 95%CI (0.23, 3.83)) and Tenericutes (ACME - 0.39, 95%CI (- 0.87, - 0.03)). There were significant differences in the distribution of phyla between this study and Qiita database (P < 0.0001).

Conclusions: Microbiota composition and metabolic potential are associated with some CMRF and fecal SCFAs concentration in obese postmenopausal women. There is no unequivocal relationship between fecal SCFAs and the marker of intestinal barrier integrity and CMRF. Further studies with appropriately matched control groups are warranted to look for causality between SCFAs and CMRF.

Keywords: Cardiometabolic risk; Menopause; Metabolism; Microbiota; Obesity; SCFA.


Conflict of interest statement

Mariusz Kaczmarczyk and Karolina Skonieczna-Żydecka receive remuneration from probiotic company. Igor Łoniewski is the probiotic company CEO. Other authors report no conflicts of interest.

Figures

Fig. 1
Fig. 1
Alpha- and beta-diversity of the gut microbiota in postmenopausal women. A violin plots of alpha-diversity indices; B heatmap of the genus-level rarefied abundance, columns (samples) and rows (taxa) were subjected to average linkage method and genus-level Bray-Curtis distance hierarchical clustering, top annotation—color bars reflect identified clusters, C bar plot of relative abundance on phylum level, D heatmap of the metabolic pathway-level rarefied abundance, columns (samples) and rows (taxa) were subjected to average linkage method and genus-level Bray-Curtis distance hierarchical clustering, top annotation—color bars reflect identified clusters; Samples were grouped using hierarchical clustering based on the inter-sample genus-level (Fig. 1B) or metabolic pathway-level (Fig. 1D) Bray-Curtis dissimilarities calculated using the rarefied abundance table. B A high taxonomic diversity which was highlighted by the presence of 9 clusters of unequal size containing from just 1 to 26 samples. D two larger clusters, containing 27 and 12 samples, were identified. Bray-Curtis distances calculated on higher taxonomic levels did not affect clustering implying a persistent high taxonomic diversity in this group (Additional file 1: Fig. S2)
Fig. 2
Fig. 2
Violin plots of SCFA [nM/mg] and calprotectin concentration [ug/ml] in stool. C2—acetic acid; C2r—The ratio of acetic acid to all analyzed SCFA; C3—propionic acid, C3r—The ratio of propionic acid to all analyzed SCFA; C4—butyric acid; C4r -The ratio of butyric acid to all analyzed SCFA, C5—valeric acid; C5r—The ratio of valeric acid to all analyzed SCFA; C6—hexanoic acid; C6r—The ratio of hexanoic acid to all analyzed SCFA
Fig. 3
Fig. 3
Relationship between microbiota, short chain fatty acids, calprotectin and anthropometric, physiological and biochemical parameters. A Spearman correlation of the alpha-diversity indices, short chain fatty acids and calprotectin (separated by vertical brown lines) with anthropometric, physiological and biochemical parameters (the three groups of parameters are separated by horizontal green lines); C Spearman correlation of the bacterial abundance at the family, order, class and phylum levels (separated by horizontal green lines) with anthropometric, physiological and biochemical parameters (separated by vertical brown lines); B, D, E, F pairwise scatterplots illustrating the relationship between two variables, observed number of unique features and LPS (B), abundance of the family Coriobacteriaceae and plasma glucose (D) or PWA PP (E), abundance of order Lactobacillales and systolic blood pressure (SBP); G, H Bray-Curtis distance-based redundancy analysis (db-RDA) ordination plots with scaling focused on correlative relationships between explanatory variables and bacterial taxa (G) or metabolic pathway abundance (H). Green points represent samples (women), red arrows represent bacteria or metabolic pathways, blue arrows represent explanatory variables. In H, colored areas represent the clusters of pathways that correlate with VF or WC according to the strength and direction of the relationship: Blue: stronger positive correlation with VF, green: weaker positive correlation with VF (marked red are pathways that re-appear in an univariate analysis), yellow: negative correlation with VF, pink: negative correlation with WC, VF—visceral fat, WC—waist circumference. Mapping from FDR adjusted P values ranges to symbols: 0–0.001 '***', 0.001–0.01 '**', 0.01–0.05 '*', 0.05–0.1 '.', 0.1—1.0 no symbol, Q—FDR adjusted P, Rho—Spearman correlation coefficient; C2r—ratio of acetic acid, C3r—ratio of propionic acid; C4r—ratio of butyric acid, C5r—ratio of valeric acid, C6r—ratio of hexanoic acid (to all analyzed SCFA)
Fig. 4
Fig. 4
Mediation analysis for glucose, PWA PP and SBP—the effects and confidence intervals. A Glucose, B PWA PP, C SBP. Taxa correlating with glucose or PWA PP or SBP (FDR P < 0.1, Fig. 3C) are shown. Marked red taxa with FDR P < 0.05 (Fig. 3C). ACME average causal mediation effect, ADE average direct effect, TE total effect. Significance of each effect can be deduced from 95% confidence intervals not containing 0

Similar articles

Cited by

References

    1. Lozupone CA, Stombaugh JI, Gordon JI, Jansson JK, Knight R. Diversity, stability and resilience of the human gut microbiota. Nature. 2012;489(7415):220–230. doi: 10.1038/nature11550. - DOI - PMC - PubMed
    1. Brahe LK, Le Chatelier E, Prifti E, Pons N, Kennedy S, Hansen T, et al. Specific gut microbiota features and metabolic markers in postmenopausal women with obesity. Nutr Diabetes. 2015;15(5):e159. doi: 10.1038/nutd.2015.9. - DOI - PMC - PubMed
    1. Cotillard A, Kennedy SP, Kong LC, Prifti E, Pons N, Le Chatelier E, et al. Dietary intervention impact on gut microbial gene richness. Nature. 2013;500(7464):585–588. doi: 10.1038/nature12480. - DOI - PubMed
    1. Le Chatelier E, Nielsen T, Qin J, Prifti E, Hildebrand F, Falony G, et al. Richness of human gut microbiome correlates with metabolic markers. Nature. 2013;500(7464):541–546. doi: 10.1038/nature12506. - DOI - PubMed
    1. Brahe LK, Le Chatelier E, Prifti E, Pons N, Kennedy S, Blædel T, et al. Dietary modulation of the gut microbiota – a randomised controlled trial in obese postmenopausal women. Br J Nutr. 2015;114(3):406–417. doi: 10.1017/S0007114515001786. - DOI - PMC - PubMed

Substances

LinkOut - more resources