

The correlation between triiodothyronine and the severity of liver fibrosis
- PMID: 36503486
- PMCID: PMC9743744
- DOI: 10.1186/s12902-022-01228-8
The correlation between triiodothyronine and the severity of liver fibrosis
Abstract
Background: The severity of liver fibrosis is an important predictor of death in patients with non-alcoholic fatty liver disease (NAFLD) and type 2 diabetes mellitus (T2DM). However, there is still no definite conclusion on the relationship between triiodothyronine (T3) and the severity of liver fibrosis. Thus, the aim of this study was to analyze the correlation between T3 level and the severity of liver fibrosis.
Methods: We performed a cross-sectional study of 2072 T2DM patients with normal thyroid function from January 2017 to January 2020. NAFLD fibrosis score (NFS), Fibrosis index based on the 4 factors (FIB-4) and BARD score (BARD) were used to assess the severity of fibrosis in T2DM patients, and linear regression analyses were used to determine the factors independently associated with liver fibrosis. Further experiments were performed to assess the impact of low T3 on fibrosis progression in mice model and explore possible mechanisms.
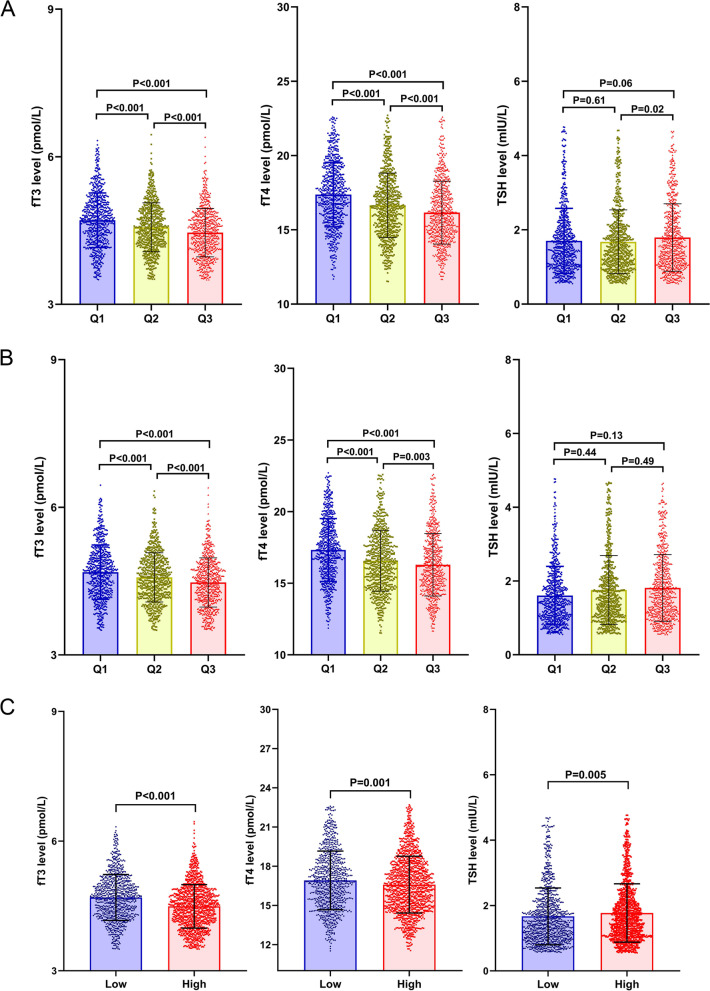
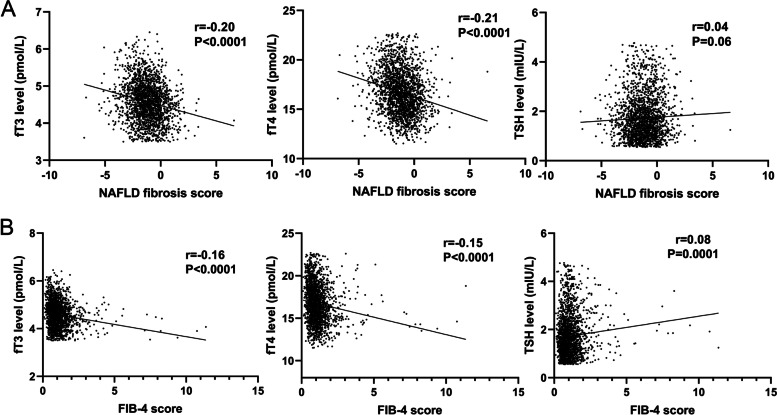
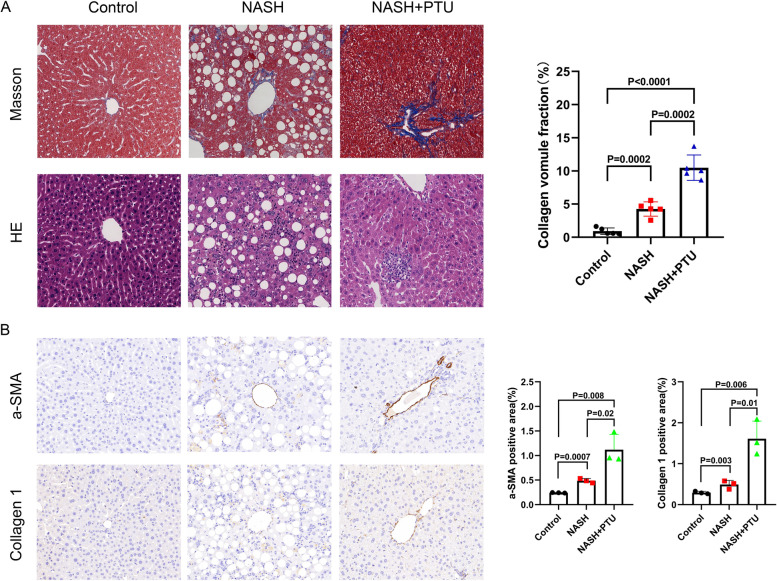
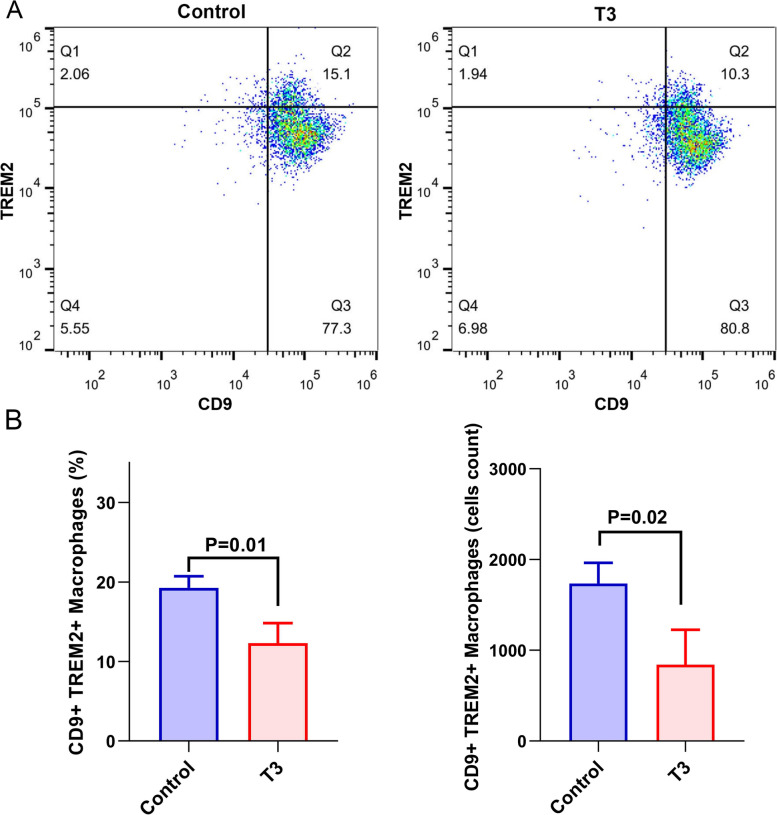
Results: Free triiodothyronine (fT3) levels had significantly inverse correlations with NFS and FIB-4, and BARD in T2DM patients (P < 0.05). In multiple linear regression analyses, decreased fT3 level was an independent risk factor for the severity of liver fibrosis of T2DM patients (P < 0.01). Findings from in-vivo experiment using mice model proved that hypothyroidism mice had more severe of liver fibrosis than those mice with normal thyroid function. We also found that T3 could inhibit the profibrotic TREM2+CD9+ macrophage, which had been identified an important player in the progression of liver fibrosis.
Conclusion: The findings from this study proved an inverse correlation between T3 level and the severity of liver fibrosis, and lower fT3 level within the normal range was an independent risk factor for severe liver fibrosis.
Keywords: Fibrosis; Free triiodothyronine; Non-alcoholic fatty liver disease; Type 2 diabetes mellitus.
© 2022. The Author(s).
Conflict of interest statement
The authors declare that they have no competing interests.
Figures
Similar articles
-
Correlation between the thyroid hormone levels and nonalcoholic fatty liver disease in type 2 diabetic patients with normal thyroid function.BMC Endocr Disord. 2022 May 31;22(1):144. doi: 10.1186/s12902-022-01050-2. BMC Endocr Disord. 2022. PMID: 35641932 Free PMC article.
-
Noninvasive fibrosis tools in NAFLD: validation of APRI, BARD, FIB-4, NAFLD fibrosis score, and Hepamet fibrosis score in a Portuguese population.Postgrad Med. 2022 May;134(4):435-440. doi: 10.1080/00325481.2022.2058285. Epub 2022 Mar 30. Postgrad Med. 2022. PMID: 35332833
-
Free Triiodothyronine Is Independently Associated with Nonalcoholic Fatty Liver Disease in Hospitalized Type 2 Diabetes Mellitus Patients.Biomed Res Int. 2021 Jan 19;2021:8868339. doi: 10.1155/2021/8868339. eCollection 2021. Biomed Res Int. 2021. Retraction in: Biomed Res Int. 2024 Jan 9;2024:9769125. doi: 10.1155/2024/9769125. PMID: 33532498 Free PMC article. Retracted.
-
Liver fibrosis in non-alcoholic fatty liver disease - diagnostic challenge with prognostic significance.World J Gastroenterol. 2015 Oct 21;21(39):11077-87. doi: 10.3748/wjg.v21.i39.11077. World J Gastroenterol. 2015. PMID: 26494963 Free PMC article. Review.
-
Comparison of laboratory tests, ultrasound, or magnetic resonance elastography to detect fibrosis in patients with nonalcoholic fatty liver disease: A meta-analysis.Hepatology. 2017 Nov;66(5):1486-1501. doi: 10.1002/hep.29302. Epub 2017 Sep 26. Hepatology. 2017. PMID: 28586172 Review.
Cited by
-
Correlation Between Thyroid-Stimulating Hormone (TSH) and Liver Function Test Values in North Karnataka Patients Admitted to a Tertiary Care Hospital.Cureus. 2024 Apr 25;16(4):e59004. doi: 10.7759/cureus.59004. eCollection 2024 Apr. Cureus. 2024. PMID: 38803746 Free PMC article.
-
Epigenetic regulation of thyroid hormone action in human metabolic dysfunction-associated steatohepatitis.Eur Thyroid J. 2024 Sep 21;13(5):e240080. doi: 10.1530/ETJ-24-0080. Print 2024 Oct 1. Eur Thyroid J. 2024. PMID: 39312733 Free PMC article.
-
The Free Triiodothyronine, Gamma-Glutamyl Transpeptidase and Spontaneous Bacterial Peritonitis Index: A Novel Model for Predicting 1-Year Mortality in Patients with HBV-Related Hepatic Encephalopathy.Hepat Med. 2024 Jan 22;16:1-9. doi: 10.2147/HMER.S450638. eCollection 2024. Hepat Med. 2024. PMID: 38283915 Free PMC article.
-
Research Advancements in the Interplay between T3 and Macrophages.Curr Med Sci. 2024 Oct;44(5):883-889. doi: 10.1007/s11596-024-2935-6. Epub 2024 Oct 24. Curr Med Sci. 2024. PMID: 39446284 Review.
-
Role of triggering receptor expressed on myeloid cells 2 in the pathogenesis of non-alcoholic fatty liver disease.World J Hepatol. 2025 Feb 27;17(2):102328. doi: 10.4254/wjh.v17.i2.102328. World J Hepatol. 2025. PMID: 40027566 Free PMC article. Review.
References
-
- McPherson S, Armstrong MJ, Cobbold JF, Corless L, Anstee QM, Aspinall RJ, et al. Quality standards for the management of non-alcoholic fatty liver disease (NAFLD): consensus recommendations from the British Association for the study of the liver and british Society of Gastroenterology NAFLD Special Interest Group. Lancet Gastroenterol Hepatol. 2022;7:755–69. doi: 10.1016/S2468-1253(22)00061-9. - DOI - PMC - PubMed
MeSH terms
Substances
Grants and funding
LinkOut - more resources
Full Text Sources
Medical
