. 2022 Dec 12;10(1):222.
doi: 10.1186/s40168-022-01396-8.

Integrated multi-omics of the gastrointestinal microbiome and ruminant host reveals metabolic adaptation underlying early life development

Affiliations

Integrated multi-omics of the gastrointestinal microbiome and ruminant host reveals metabolic adaptation underlying early life development

Xiaoting Yan et al. Microbiome. .

Abstract

Background: The gastrointestinal tract (GIT) microbiome of ruminants and its metabolic repercussions vastly influence host metabolism and growth. However, a complete understanding of the bidirectional interactions that occur across the host-microbiome axis remains elusive, particularly during the critical development stages at early life. Here, we present an integrative multi-omics approach that simultaneously resolved the taxonomic and functional attributes of microbiota from five GIT regions as well as the metabolic features of the liver, muscle, urine, and serum in sika deer (Cervus nippon) across three key early life stages.

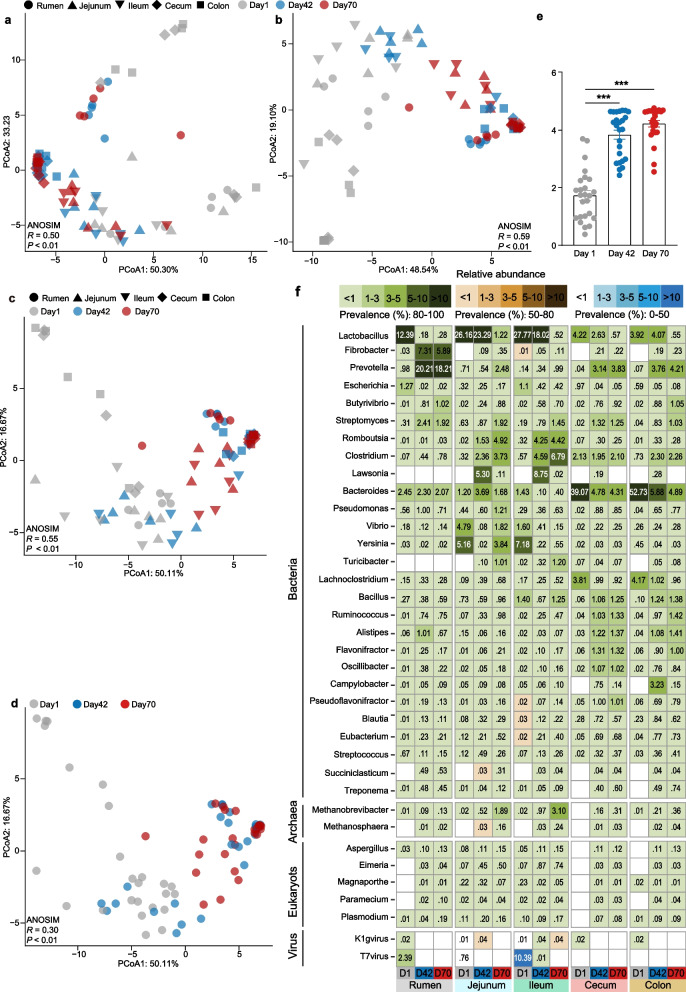
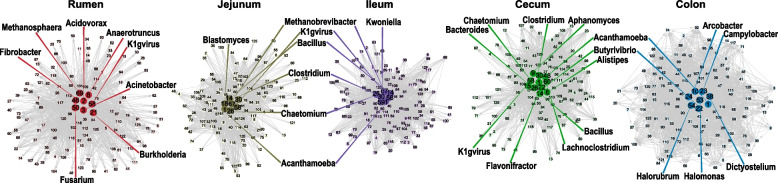
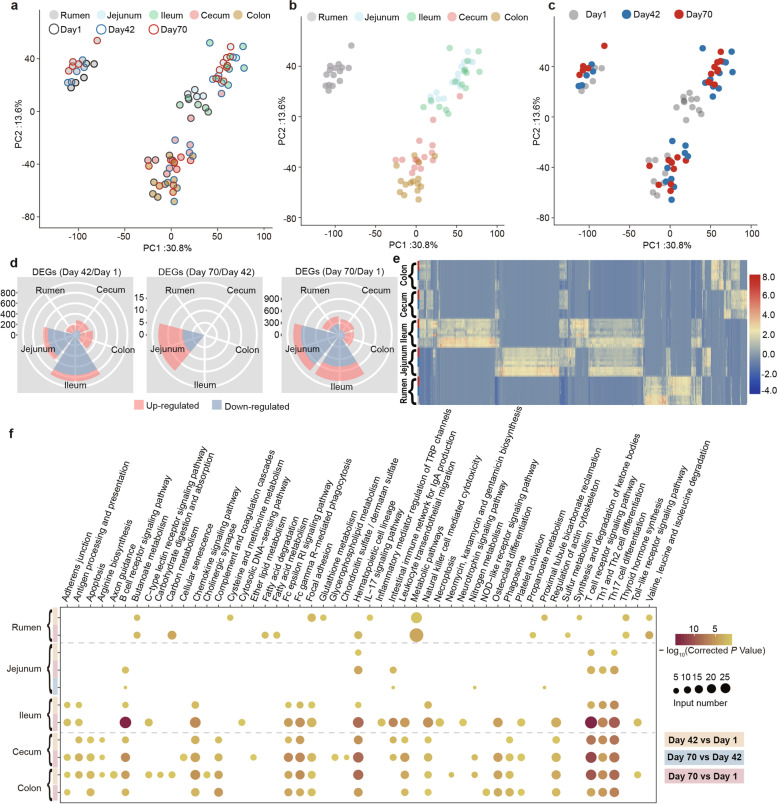
Results: Within the host, analysis of metabolites over time in serum, urine, and muscle (longissimus lumborum) showed that changes in the fatty acid profile were concurrent with gains in body weight. Additional host transcriptomic and metabolomic analysis revealed that fatty acid β-oxidation and metabolism of tryptophan and branched chain amino acids play important roles in regulating hepatic metabolism. Across the varying regions of the GIT, we demonstrated that a complex and variable community of bacteria, viruses, and archaea colonized the GIT soon after birth, whereas microbial succession was driven by the cooperative networks of hub populations. Furthermore, GIT volatile fatty acid concentrations were marked by increased microbial metabolic pathway abundances linked to mannose (rumen) and amino acids (colon) metabolism. Significant functional shifts were also revealed across varying GIT tissues, which were dominated by host fatty acid metabolism associated with reactive oxygen species in the rumen epithelium, and the intensive immune response in both small and large intestine. Finally, we reveal a possible contributing role of necroptosis and apoptosis in enhancing ileum and colon epithelium development, respectively.

Conclusions: Our findings provide a comprehensive view for the involved mechanisms in the context of GIT microbiome and ruminant metabolic growth at early life. Video Abstract.

Keywords: Butyrate; Cooperation; Early life; Fatty acid metabolism; Immune response; Ontogeny; Region- and stage-specific development.


Conflict of interest statement

The authors declare that they have no competing interests.

Figures

Fig. 1
Fig. 1
A metabolic view and signature of sika deer from birth to postweaning. a The column chart revealing the growth of whole-body wet weight of sika deer at days 1 (gray), 42 (blue), and 70 (red). PLS-DA showing the shift of amino acids (b) and fatty acids (c) in longissimus lumborum (LL) of sika deer among the three stages. d Box plots showing 4 metabolites in LL significantly changed during early growth period. Benjamini-Hochberg-adjusted P-values were determined by ANOVA. Bar and whiskers represent the mean ± s.d. PLS-DA and heat map revealing the changed metabolites in serum (e and g) and urine (f and h). Metabolite samples at days 1, 42, and 70 in the PLS-DA plot are colored by gray, blue, and red circles, respectively. The metabolites differentially expressed in heat map were identified by VIP values (> 1), SAM, and/or ANOVA methods. i The significantly changed concentrations of the triglyceride and cholesterol in serum. The gray, blue, and red bars at top of heat map represent the samples at days 1, 42, and 70, respectively. *, **, and *** indicate the Benjamini-Hochberg-adjusted P-value < 0.05, < 0.01, and < 0.001, respectively
Fig. 2
Fig. 2
Global transcriptional and metabolic shift in the liver of sika deer from birth to postweaning. a PCA of all hepatic expressed genes. PCA vector separates samples into age groups and is colored by gray, blue, and red circles, respectively. b A circular plot showing 10 significantly enriched pathways of the upregulated DEGs in liver. The DEGs were determined by the fold change ≥ 2 and a Benjamini-Hochberg-adjusted P-value < 0.05. The pink and light blue curves represent the comparison of day 70 vs day 1 and day 70 vs day 42, respectively. The number at out circle indicates the size of the gene sets in each pathway. Pathway enrichment analysis was performed by a one-side Fisher test based on the pathway annotations (full results were supplied in Table S2). c Comparison of the overlapped and specific upregulated DEGs and the enriched pathways in the liver. The pink and light blue circles represent the comparison of day 70 vs day 1 and day 70 vs day 42, respectively. d PCA of all sika deer hepatic metabolome samples. PCA vector separates samples into age groups and is colored by gray, blue and red circles, respectively. e PCA of the global metabolome liver are colored (gray to blue to red) to the age groups. f Heat map of metabolites differentially expressed across the different time points in the liver, constrained to the significant metabolites identified by VIP values (> 1), SAM, and/or ANOVA methods. Colors indicate the normalized relative concentration of each metabolite from minimum (blue) to maximum (red). From top to bottom: day 1: gray, day 42: blue, and day 70: red
Fig. 3
Fig. 3
Regional taxonomic differences of GIT microbiota of sika deer from birth to postweaning. PCoA of GIT taxonomic community composition at phylum (a), family (b), and genus levels (c, d) based on Bray-Curtis dissimilarity. The microbial samples from GIT regions were indicated as different shapes (rumen: circle, jejunum: triangle, ileum: inverted triangle, cecum: rhombus, and colon: square), and different time points were indicated by filling color (day 1: gray, day 42: blue, day 70: red) in a, b, and c. ANOSIM analysis was used for statistical testing of group similarities. The proportion of variation explained for each axis is given after colon. e Bar plot revealing the Shannon diversity index among the three age groups. The diversity index was calculated using the taxonomic composition at genus level. Bar and whiskers represent the mean ± s.d. f Relative abundances of bacteria, archaea, eukaryotes, and virus, as averaged over all samples (n = 5) in each GIT regions for each time points, are given as percentages (× 100). Prevalence heat map indicates the proportion of any specific taxonomy observed in all samples. D, day. *** indicates the Benjamini-Hochberg-adjusted P-value < 0.001
Fig. 4
Fig. 4
Microbial Zal-based altruism network in the GIT of sika deer. The altruism network at the genus level within the gut microbiota in rumen, jejunum, ileum, cecum, and colon. In each network, hub microbes are highlighted in dark circles. These hub microbes, expressed as beneficiaries in altruism networks, are compared with other microbes from each network type, called altruists
Fig. 5
Fig. 5
Metabolic signature in GIT regions of sika deer from birth to postweaning. PCoA of GIT metabolic profiles at KO (a, b, c) and KEGG level 3 (d, e, f) based on Bray-Curtis dissimilarity. ANOSIM analysis was used for statistical testing of group similarities. The proportion of variation explained for each axis is given after colon. g, h, and i PCA of metabolome in five GIT regions. The samples from GIT regions among the three time points indicated as different shapes (rumen: circle, jejunum: triangle, ileum: inverted triangle, cecum: rhombus, and colon: square) and filling color (day 1: gray, day 42: blue, day 70: red) in a, d, and g. j The significantly changed pathways. The circle sizes indicate the relative abundance of each pathway and were colored by GIT regions (rumen: gray, jejunum: light blue, ileum: light green, cecum: pink, and colon: yellow). The significances were determined a Benjamini-Hochberg-adjusted P-value < 0.05 using relative abundances of KEEG level 3. From bottom to top: rumen, jejunum, ileum, cecum, and colon including three time points (day 1: gray, day 42: blue, day 70: red). Full results were supplied in Table S5
Fig. 6
Fig. 6
Integrative metabolic view in the rumen and colon of sika deer between birth and postweaning. Histogram showing the significantly enriched pathways in rumen (a) and colon (b). Pathway enrichment analysis was performed by a one-side Fisher test based on the significantly increased KOs (full results were supplied in Table S6). The significance of KOs was determined by a Benjamini-Hochberg-adjusted P-value < 0.05 based on the relative abundance between day 70 vs day 1. The x-axis represents the gene sets in each pathway. The graphs of the metabolic pathways of carbohydrate and amino acids in rumen (c) and colon (d). The light green and light blue backgrounds represent the metabolism of carbohydrate and amino acids, respectively. The rounded rectangle and ellipse indicate metabolites associated with carbohydrate and amino acids, respectively. Red- and brown-rounded rectangle/ellipse indicate the significantly increased/increased, while blue and gray rectangle/ellipse indicate the significantly decreased/decreased. The significant increase of enzyme codes and gene names between day 70 vs day 1 in the pathways was indicated as red text. P, phosphate; PEP, phosphoenolpyruvate; G3P, glycerol 3-phosphate; Tyr, tyrosine; Phe, phenylalanine; Ser, serine; Cys, cysteine; Thr, threonine; Ile, isoleucine; Asp, aspartate; Met, methionine; Lys, lysine; Gly, glycine; Pro, proline; and Arg, arginine
Fig. 7
Fig. 7
Comparative analysis of GIT epithelial function at early life development stages of sika deer. PCA of all expressed genes in 5 rumen, jejunum, ileum, cecum, and colon among the three time points (ac). PCA vector separates samples into GIT regions using fill color of circle (rumen: gray, jejunum: light blue, ileum: light green, cecum: pink, and colon: yellow) and age groups using outer line color (day 1: gray, day 42: blue, day 70: red) a and b. PCA vector separates samples into age groups using different filling color (day 1: gray, day 42: blue, day 70: red) in c. d Rose diagrams showing the numbers of DEGs in the five GIT regions. Pink and blue represent the up- and downregulated DEGs, respectively. The DEGs were determined by the fold change ≥ 2 and a Benjamini-Hochberg-adjusted P-value < 0.05. e Heat map showing the distribution of DEGs in rumen, jejunum, ileum, cecum, and colon (from bottom to top). Each row represents one sample, and each column represents one gene. Individuals are colored (blue to red) to indicate expression level (low to high). f Representative pathways enriched in upregulated DEGs based on functional enrichment analysis in five GIT regions. The vertical axis represents the pathway categories, and the horizontal axis shows the enrichment factor. The circle size represents the number of gene sets. The bigger the point size, the more genes in the pathway. The circle color indicates the logarithm of P-values calculated as the fraction of permutation values. The color legend at the left of heat map indicates the different comparisons

References

    1. Shabat SKB, Sasson G, Doron-Faigenboim A, Durman T, Yaacoby S, Berg Miller ME, White BA, Shterzer N, Mizrahi I. Specific microbiome-dependent mechanisms underlie the energy harvest efficiency of ruminants. ISME J. 2016;10(12):2958–2972. doi: 10.1038/ismej.2016.62. - DOI - PMC - PubMed
    1. Yeoman CJ, Ishaq SL, Bichi E, Olivo SK, Lowe J, Aldridge BM. Biogeographical differences in the influence of maternal microbial sources on the early successional development of the bovine neonatal gastrointestinal tract. Sci Rep. 2018;8(1):3197. doi: 10.1038/s41598-018-21440-8. - DOI - PMC - PubMed
    1. Furman O, Shenhav L, Sasson G, Kokou F, Honig H, Jacoby S, Hertz T, Cordero OX, Halperin E, Mizrahi I. Stochasticity constrained by deterministic effects of diet and age drive rumen microbiome assembly dynamics. Nat Commun. 2020;11(1):1–13. doi: 10.1038/s41467-020-15652-8. - DOI - PMC - PubMed
    1. Fan P, Nelson CD, Driver JD, Elzo MA, Peñagaricano F, Jeong KC. Host genetics exerts lifelong effects upon hindgut microbiota and its association with bovine growth and immunity. ISME J. 2021;15(8):2306–2321. doi: 10.1038/s41396-021-00925-x. - DOI - PMC - PubMed
    1. Malmuthuge N, Liang G, Griebel PJ, Guan LL. Taxonomic and functional compositions of the small intestinal microbiome in neonatal calves provide a framework for understanding early life gut health. Appl Environ Microbiol. 2019;85(6):e02534–e02518. doi: 10.1128/AEM.02534-18. - DOI - PMC - PubMed

Publication types

Substances

LinkOut - more resources