. 2022 Dec 12;20(1):581.
doi: 10.1186/s12967-022-03763-3.

Acidic ascites inhibits ovarian cancer cell proliferation and correlates with the metabolomic, lipidomic and inflammatory phenotype of human patients

Affiliations

Acidic ascites inhibits ovarian cancer cell proliferation and correlates with the metabolomic, lipidomic and inflammatory phenotype of human patients

Qianlu Yang et al. J Transl Med. .

Abstract

Background: The poor prognosis of ovarian cancer patients is strongly related to peritoneal metastasis with the production of malignant ascites. However, it remains largely unclear how ascites in the peritoneal cavity influences tumor metabolism and recurrence. This study is an explorative approach aimed at for a deeper molecular and physical-chemical characterization of malignant ascites and to investigate their effect on in vitro ovarian cancer cell proliferation.

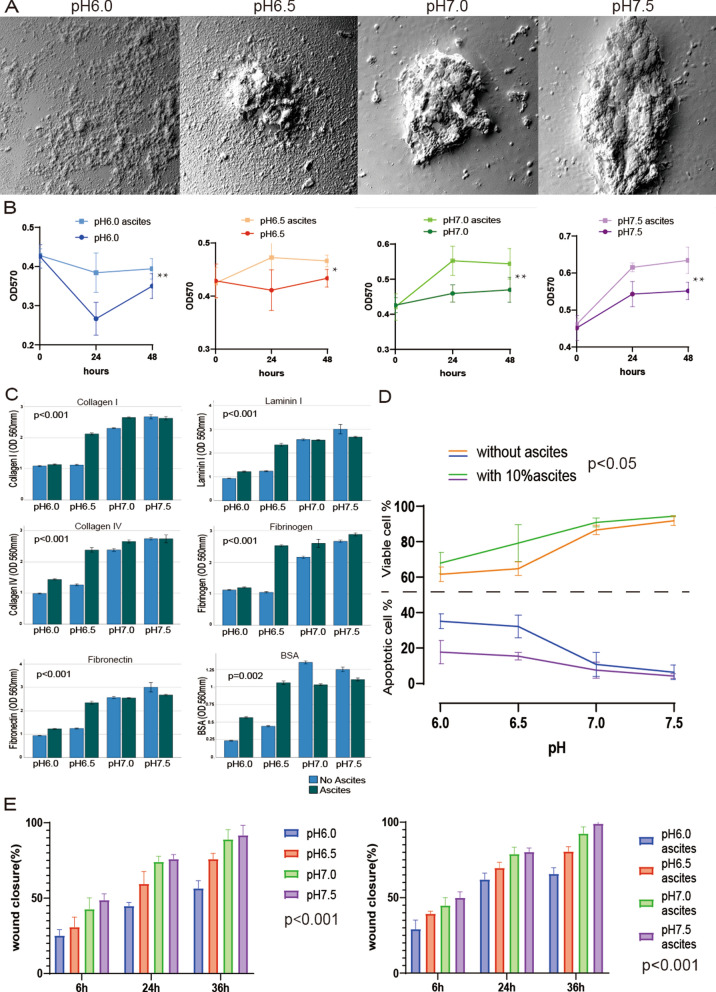
Methods: This study included 10 malignant ascites specimens from patients undergoing ovarian cancer resection. Ascites samples were deeply phenotyped by 1H-NMR based metabolomics, blood-gas analyzer based gas flow analysis and flow cytomertry based a 13-plex cytokine panel. Characteristics of tumor cells were investigated in a 3D spheroid model by SEM and metabolic activity, adhesion, anti-apoptosis, migratory ability evaluated by MTT assay, adhesion assay, flowcytometry and scratch assay. The effect of different pH values was assessed by adding 10% malignant ascites to the test samples.

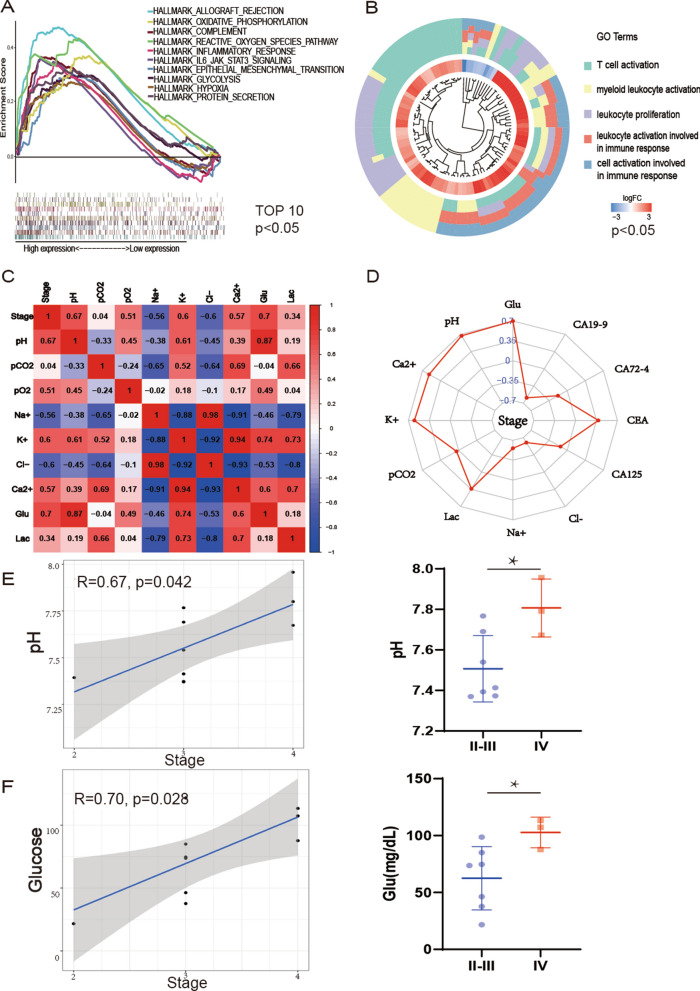
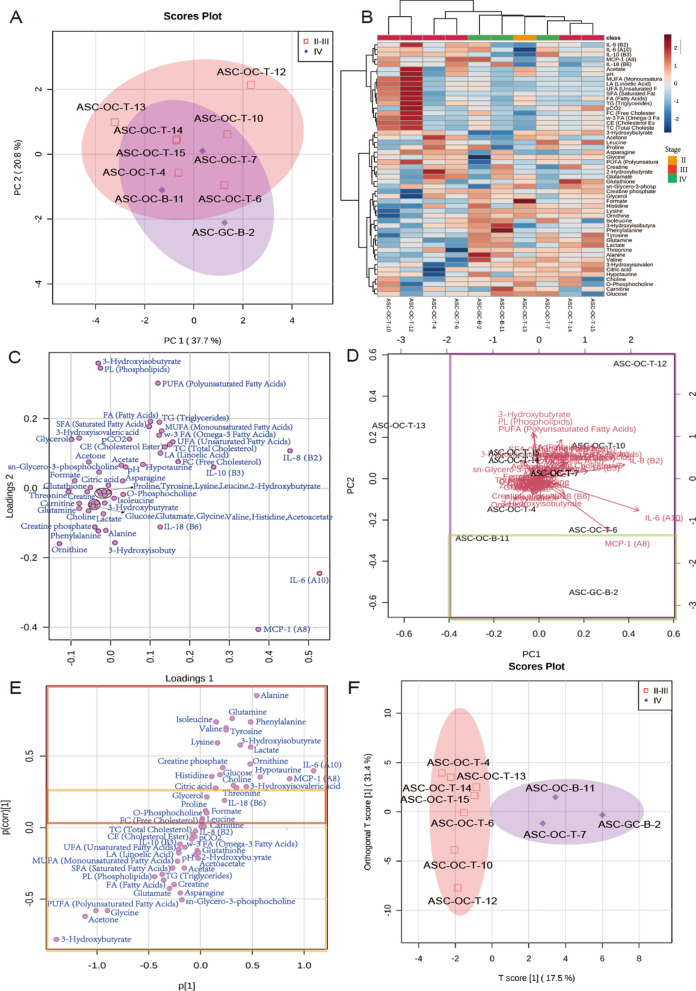
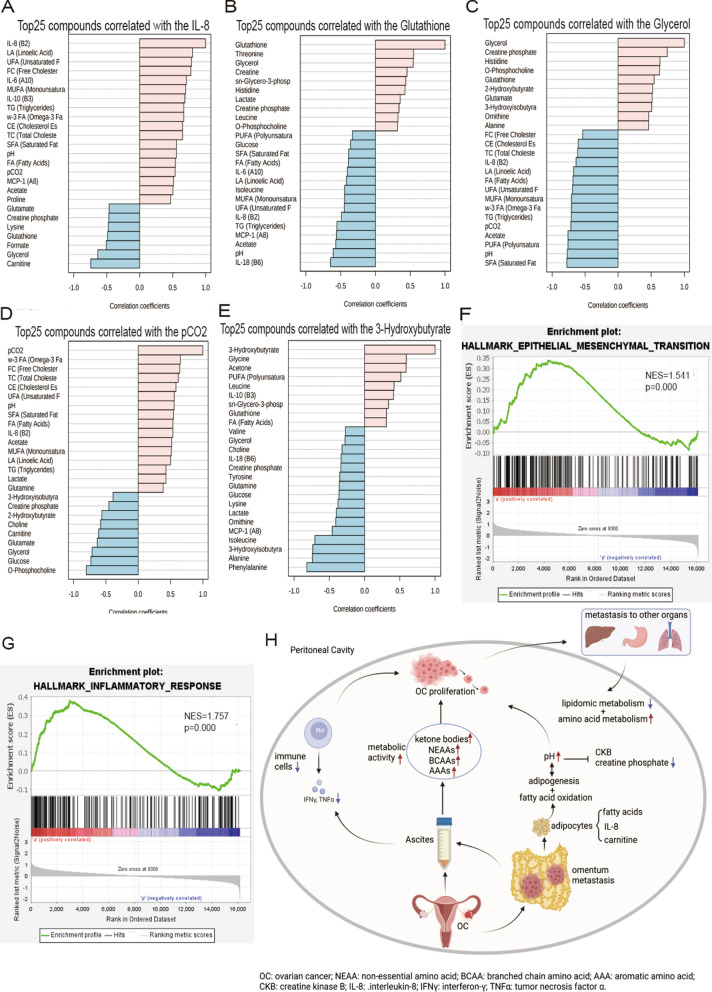
Results: The overall extracellular (peritoneal) environment was alkaline, with pH of ascites at stage II-III = 7.51 ± 0.16, and stage IV = 7.78 ± 0.16. Ovarian cancer spheroids grew rapidly in a slightly alkaline environment. Decreasing pH of the cell culture medium suppressed tumor features, metabolic activity, adhesion, anti-apoptosis, and migratory ability. However, 10% ascites could prevent tumor cells from being affected by acidic pH. Metabolomics analysis identified stage IV patients had significantly higher concentrations of alanine, isoleucine, phenylalanine, and glutamine than stage II-III patients, while stage II-III patients had significantly higher concentrations of 3-hydroxybutyrate. pH was positively correlated with acetate, and acetate positively correlated with lipid compounds. IL-8 was positively correlated with lipid metabolites and acetate. Glutathione and carnitine were negatively correlated with cytokines IL-6 and chemokines (IL-8 & MCP-1).

Conclusion: Alkaline malignant ascites facilitated ovarian cancer progression. Additionally, deep ascites phenotyping by metabolomics and cytokine investigations allows for a refined stratification of ovarian cancer patients. These findings contribute to the understanding of ascites pathology in ovarian cancer.

Keywords: Cell culture; Cytokine; In vitro; In vivo; Metabolic profile; Peritoneal fluid; pH.


Conflict of interest statement

Page 21/32 QY, GyB, GN, AC, GeB, LZ, AK, YS, FJW, SK, MAR and CT declare that they have no competing interests.

Figures

Fig. 1
Fig. 1
Malignant ascites help cancer cells resist the inhibition of pH changes despite acidic extracellular environment. A Scanning electron microscopy (570X): Ovarian cancer spheroids showed barely any growth in the lower pH group and rapid growth in the slightly alkaline environment (pH range: 6.0, 6.5, 7.0, 7.5). B MTT assay: Malignant ascites increased the metabolism of tumor cells in different pH environments (n = 6, * < 0.05, ** < 0.01). C Adhesion assay: The adhesion of ovarian cancer cells to collagen I, laminin I, collagen IV, fibrinogen, fibronectin, and BSA was inhibited by the acidic environment (n = 3, p < 0.001). Furthermore, malignant ascites at pH 6.5 increased the adhesion of cancer cells (p < 0.05). D Flow cytometry: Apoptotic cell ratio decreases with increasing pH (n = 3, p < 0.05). Malignant ascites decreases the rate of apoptotic cells at different pH, especially in an acidic environment. E Scratch assay: The acidic environment inhibited the migration ability of ovarian cancer cells (n = 3, p < 0.001). Malignant ascites increased the migration of cancer cells
Fig. 2
Fig. 2
Bioinformatics analysis of ascites ovarian cancer cells and primary or metastatic cancer cells. A Gene set enrichment analysis (GSEA) analysis: The first ten hallmark gene sets of ascites cells and primary cells (p < 0.05). B The circle plots show Gene ontology (GO) pathway enrichment data for differential genes in ascites cells (p < 0.05). C Correlation of physical–chemical parameters of ascites. D Radar plot shows the correlation of ascites parameters and tumor markers with patient stages. E Spearman plot and box plot of pH and stages. F Spearman plot and box plot of glucose and stages (* < 0.05)
Fig. 3
Fig. 3
Polar and lipid metabolites levels in ovarian cancer ascites of stages II-III vs IV. A Volcano plot indicating statistically significant polar and lipid metabolites changes between the tumor stages: red and blue plots mean up and down regular in stage IV. B Bar plot of fold change (FC) of pola and lipid metabolites and cytokines, blue and yellow means upregulation and downregulation in stage IV. C Individual metabolite dot plots showing alanine, glutamine, isoleucine, phenylalanine,valine and 3-hydroxybutyrate concentration changes between tumor stages II-III and IV (* < 0.05, ** < 0.01). D Spearman plot of alanine, glutamine and phenylalanine with stages (p < 0.05)
Fig. 4
Fig. 4
Metabolomics of multivariate statistical analysis on ovarian cancer ascites stages II-IV. A Principal component analysis (PCA) scores plot of OCs. B Heatmap with all the parameters based on stages II-III versus IV. C PCA loadings plot of illustrating features that drive principal component separation. D PCA biplot, green and purple boxes indicate the involvement of in other organs and omentum majus, respectively. E Orthogonal orthogonal partial least-squares discrimination analysis (OPLS-DA) -loadings plot, orange box indicates metabolite involvement in omentum, while red box indicates involvement in other organs. F OPLS-scores plot of OCs illustrates clear II-III and IV group separation
Fig. 5
Fig. 5
Dysregulated polar, lipid metabolism and inflammation could impact the survival of OC patients. A Patients Kaplan–Meier curve. B Correlation heatmap of all the selected parameters. Pattern hunter correlation analysis of C pH and D acetate. Gene enrichment plots of ascites cancer cells on E reactive oxygen species pathway, F fatty acid metabolism and G adipogenesis
Fig. 6
Fig. 6
A nexus of dysregulated metabolic pathways, inflammation, and cell transitions in OC patients. Pattern hunter correlation analysis of A IL-8, B glutathione, C glycerol, D pCO2, E 3-Hydroxybutyrate. Ascites cancer cells genes enrichment plots of F epithelial-mesenchymal transition and G inflammatory response. H Graphical abstract of metabolites, cytokines and pH interaction in ascites and their association with cellular proliferation and organ metastasis in ovarian cancer

References

    1. Momenimovahed Z, et al. Ovarian cancer in the world: epidemiology and risk factors. Int J Women's Health. 2019;11:287. doi: 10.2147/IJWH.S197604. - DOI - PMC - PubMed
    1. Talmadge JE, Fidler IJ. AACR centennial series: the biology of cancer metastasis: historical perspective. Can Res. 2010;70(14):5649–5669. doi: 10.1158/0008-5472.CAN-10-1040. - DOI - PMC - PubMed
    1. Sluiter N, et al. Adhesion molecules in peritoneal dissemination: function, prognostic relevance and therapeutic options. Clin Exp Metas. 2016;33(5):401–416. doi: 10.1007/s10585-016-9791-0. - DOI - PMC - PubMed
    1. Archid R, Solass W, Tempfer C, Königsrainer A, Adolph M, Reymond MA, Wilson RB. Cachexia anorexia syndrome and associated metabolic dysfunction in peritoneal metastasis. Int J Mol Sci. 2019;20(21):5444. doi: 10.3390/ijms20215444. - DOI - PMC - PubMed
    1. Hilal Z, et al. Nutritional status, cachexia, and anorexia in women with peritoneal metastasis and intraperitoneal chemotherapy: a longitudinal analysis. J Gynecol Oncol. 2017;28(6):e80. doi: 10.3802/jgo.2017.28.e80. - DOI - PMC - PubMed