. 2023 Mar;150(3):248-261.
doi: 10.1017/S0031182022001688. Epub 2022 Dec 12.

Revisiting fecal metatranscriptomics analyses of macaques with idiopathic chronic diarrhoea with a focus on trichomonad parasites

Affiliations

Revisiting fecal metatranscriptomics analyses of macaques with idiopathic chronic diarrhoea with a focus on trichomonad parasites

Nicholas P Bailey et al. Parasitology. 2023 Mar.

Abstract

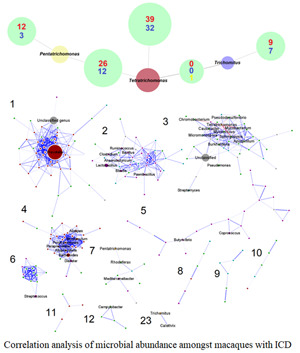
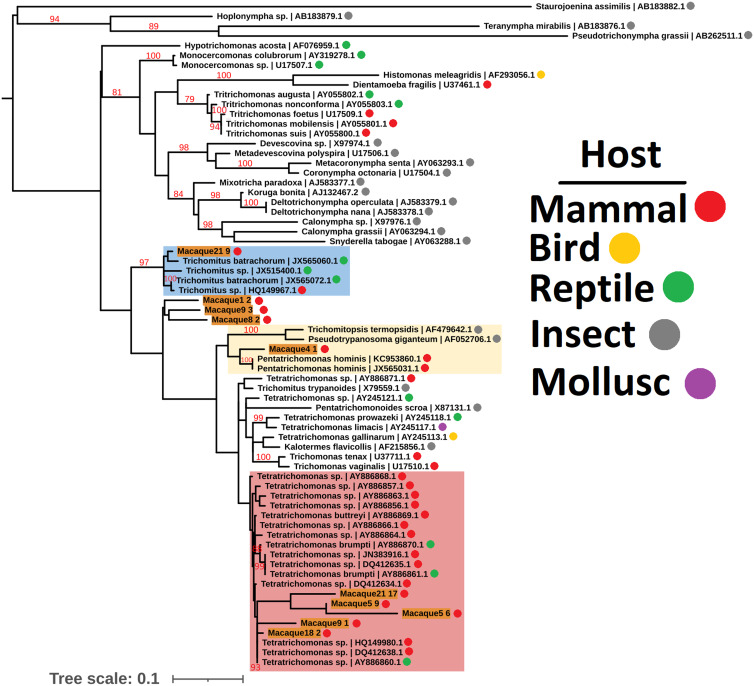
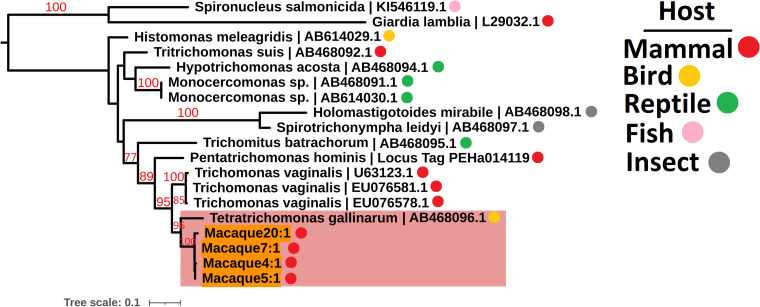
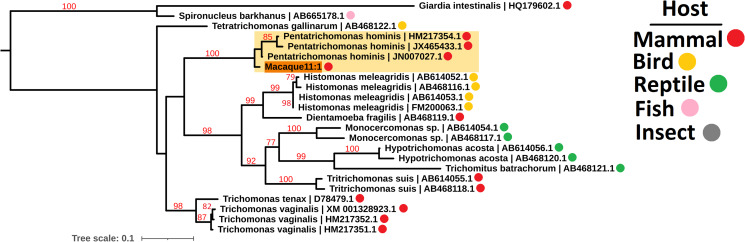
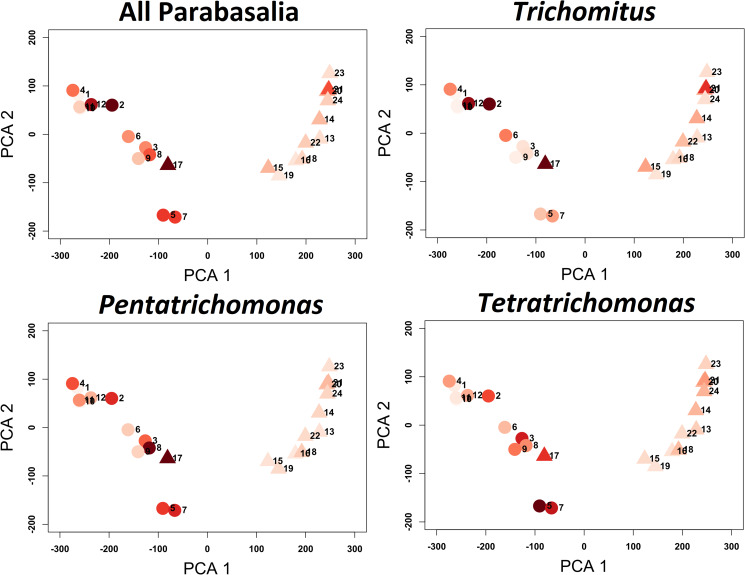
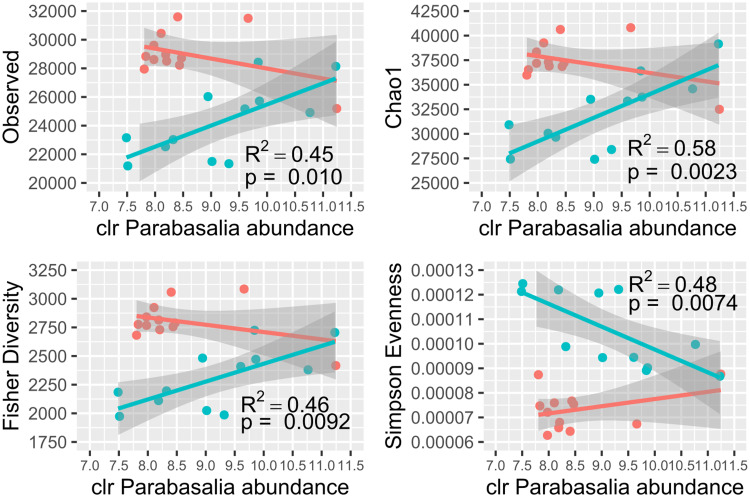
Trichomonads, anaerobic microbial eukaryotes members of the phylum Parabasalia, are common obligate extracellular symbionts that can lead to pathological or asymptomatic colonization of various mucosal surfaces in a wide range of animal hosts. Results from previous in vitro studies have suggested a number of intriguing mucosal colonization strategies by Trichomonads, notably highlighting the importance of interactions with bacteria. However, in vivo validation is currently lacking. A previous metatranscriptomics study into the cause of idiopathic chronic diarrhoea in macaques reported the presence of an unidentified protozoan parasite related to Trichomonas vaginalis. In this work, we performed a reanalysis of the published data in order to identify the parasite species present in the macaque gut. We also leveraged the information-rich metatranscriptomics data to investigate the parasite behaviour in vivo. Our results indicated the presence of at least 3 genera of Trichomonad parasite; Tetratrichomonas, Pentatrichomonas and Trichomitus, 2 of which had not been previously reported in the macaque gut. In addition, we identified common in vivo expression profiles shared amongst the Trichomonads. In agreement with previous findings for other Trichomonads, our results highlighted a relationship between Trichomonads and mucosal bacterial diversity which could be influential in health and disease.

Keywords: Macaque; Pentatrichomonas; Tetratrichomonas; Trichomitus; Trichomonads; metatranscriptomics.


Conflict of interest statement

The authors declare that there are no conflicts of interest.

Figures

None
Graphical abstract
Fig. 1.
Fig. 1.
Unrooted maximum likelihood phylogeny (GTR model with empirical base frequencies, invariable sites and the discrete gamma model) of Parabasalia-like 18S rRNA sequences from the macaque fecal metatranscriptome, alongside a range of Parabasalia species. Bootstrap values (1000 replicates) greater than 75% are shown on branches in red. Units for tree scale are inferred substitutions per base pair. Macaque-derived sequences (highlighted in orange) are named sequentially according to the animal from which they originated, e.g. Macaque1:1, Macaque1:2. Major lineages of macaque-derived Tetratrichomonas-like, Pentatrichomonas-like and Trichomitus-like sequences are highlighted in red, yellow and blue, respectively. Where available, Genbank accessions (Benson et al., 2015) are shown at the ends of tip labels.
Fig. 2.
Fig. 2.
Maximum likelihood phylogeny (TIM2e model with equal base frequencies and the discrete gamma model) of Parabasalia-like actin sequences from the macaque fecal metatranscriptome alongside a range of Parabasalia species. Phylogeny is rooted using sequences from Giardia lamblia (accession L29032.1) and Spironucleus salmonicida (accession KI546119.1) as an outgroup (not shown). Bootstrap values (1000 replicates) greater than 75% are shown on branches in red. Units for tree scale are inferred substitutions per base pair. Macaque-derived sequences (highlighted in orange) are named sequentially according to the animal from which they originated, e.g. Macaque1:1, Macaque1:2. The major Tetratrichomonas-like lineage of macaque-derived sequences is highlighted in red. Coloured dots indicate animal host taxa. Where available, Genbank accessions (Benson et al., 2015) are shown at the ends of tip labels.
Fig. 3.
Fig. 3.
Maximum likelihood phylogeny (TIM2 model allowing unequal base frequencies, with empirical base frequencies, invariable sites and the discrete gamma model) of Parabasalia-like EF-1α sequences from the macaque fecal metatranscriptome, alongside a range of Parabasalia species. Phylogeny is rooted using sequences from Giardia intestinalis (accession HQ179602.1) and Spironucleus barkhanus (accession AB665178.1) as an outgroup (not shown). Bootstrap values (1000 replicates) greater than 75% are shown on branches in red. Units for tree scale are inferred substitutions per base pair. Macaque-derived sequences (highlighted in orange) are named sequentially according to the animal from which they originated, e.g. Macaque1:1, Macaque1:2. The major Pentatrichomonas-like lineage of macaque-derived sequences is highlighted in yellow. Coloured dots indicate animal host taxa. Where available, Genbank accessions (Benson et al., 2015) are shown at the ends of tip labels.
Fig. 4.
Fig. 4.
Summary of microbial abundances amongst control macaques and this with idiopathic chronic diarrhoea. (A) Parabasalia genera of interest, (B) Phyla excluding the host or Parabasalia (C) Bacteroidetes genera and (D) Firmicutes genera. (B-D) show the abundance of the top 10 most abundant taxa (sum across all samples). Abundances are presented as a percentage of the total sequence library size. The ‘other’ category groups the rest of taxa not shown, and lines separate the subdivisions within these bars. The ‘unclassified’ category represents sequence reads which have been assigned to the relevant taxon of interest for the plot, but not to any specific phylum or genus. Samples are ordered 1–24 from left to right.
Fig. 5.
Fig. 5.
Principal component analysis (PCA) plot for Aitchison distance based on non-parabaslid microbial abundances amongst macaque fecal samples. Points are shaded according to the centred log ratio normalized abundance values for all Parabasalia, Trichomitus, Pentatrichomonas and Tetratrichomonas, with darker shades indicating greater abundance. Triangle and circular points indicate healthy and diseased animals, respectively.
Fig. 6.
Fig. 6.
Relationship between Parabasalia abundance (normalized by centred log-ratio; clr) and microbial diversity metrics. Observed refers to the total number of observed taxa. Macaques with idiopathic chronic diarrhoea (ICD) and healthy controls are shown in pink and turquoise, respectively. Lines indicate separate linear regressions fitted for the ICD and control groups, and the shaded areas indicate 95% confidence intervals. The significant linear regression P values (<0.05) and corresponding R2 values derived from the ICD sample are indicated next to the corresponding line. The linear regression results for the control macaques were not significant (P value >0.05).
Fig. 7.
Fig. 7.
Correlation analysis of microbial abundance amongst macaques with idiopathic chronic diarrhoea. (A) DiVenn (Sun et al., 2019) figure showing overlap of positive (red) and negative (blue) correlations with bacteria amongst the parabasalid genera of interest. Yellow colour indicates shared correlations for which the direction of correlation differs between the groups. (B) Summary table for the microbial correlation networks. (C) Correlation network of the most abundant microbial genera (greater than 0.005% in at least 1 sample). Edges link nodes (genera) for which abundance was strongly correlated (sharing a significant correlation coefficient greater than 0.8). Node size is scaled to percentage abundance (ignoring the abundance of the ‘unclassified’ group), and labels for genera with less than 0.1% abundance are omitted (except for Parabasalia nodes and their immediate neighbours). Nodes are coloured according to phylum (Actinobacteria; turquoise, Bacteroides; pink, Firmicutes; purple, Proteobacteria; green and Parabasalia; orange) and edge transparency is scaled to the magnitude of the correlation coefficient. Edges linking to Tetratrichomonas are highlighted in red. Connected components are numbered sequentially by decreasing number of nodes and connected components with fewer than 7 nodes are not shown, except those that contain Parabasalia (21 connected components are not shown).

Similar articles

Cited by

References

    1. Adhikari PP and Dhakal P (2018) Prevalence of gastro-intestinal parasites of rhesus macaque (Macaca mulatta Zimmermann, 1780) and hanuman langur (Semnopithecus entellus Dufresne, 1797) in Devghat, Chitwan, Nepal. Journal of Institute of Science and Technology 22, 7.
    1. Altschul SF, Gish W, Miller W, Myers EW and Lipman DJ (1990) Basic local alignment search tool. Journal of Molecular Biology 215, 403–410. - PubMed
    1. Andrews S (2018) FastQC. Vol. 2018 Babraham bioinformatics. https://www.bioinformatics.babraham.ac.uk/projects/fastqc/
    1. Arroyo R, Cárdenas-Guerra RE, Figueroa-Angulo EE, Puente-Rivera J, Zamudio-Prieto O and Ortega-López J (2015) Trichomonas vaginalis cysteine proteinases: iron response in gene expression and proteolytic activity. Biomedical Research International 2015, 946787. - PMC - PubMed
    1. Bastos BF, Brener B, de Figueiredo MA, Leles D and Mendes-de-Almeida F (2018) Pentatrichomonas hominis infection in two domestic cats with chronic diarrhoea. Journal of Feline Medicine and Surgery Open Reports 4, 2055116918774959. - PMC - PubMed

Publication types