. 2022 Dec 11;12(1):21422.
doi: 10.1038/s41598-022-24740-2.

Establishment of multi-stage intravenous self-administration paradigms in mice

Affiliations

Establishment of multi-stage intravenous self-administration paradigms in mice

Lauren M Slosky et al. Sci Rep. .

Abstract

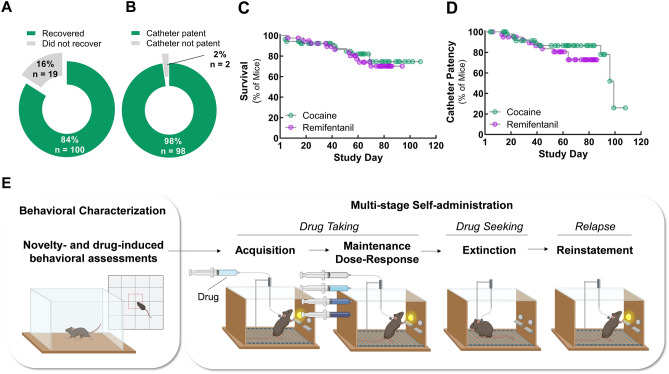
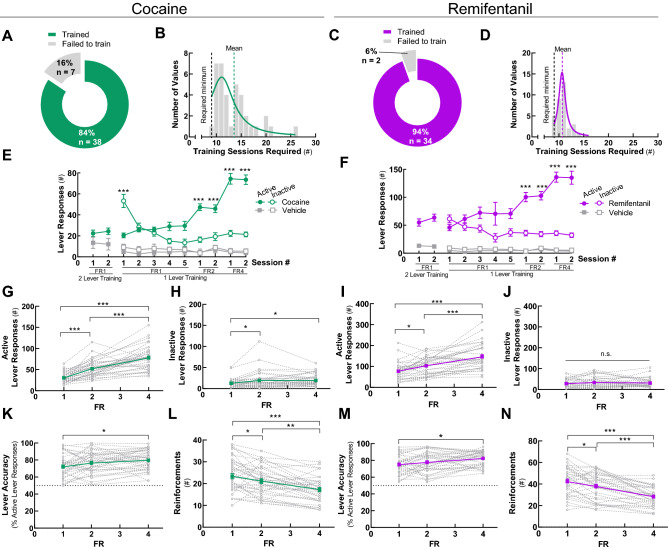
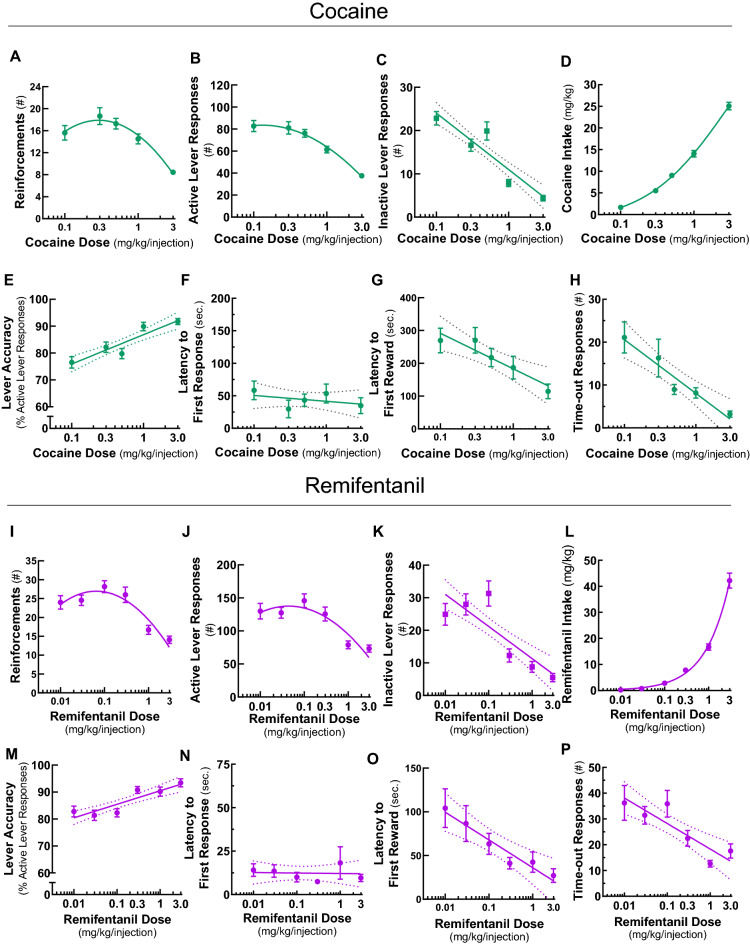
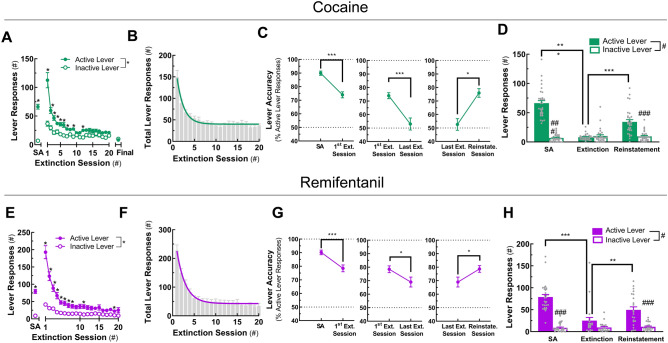
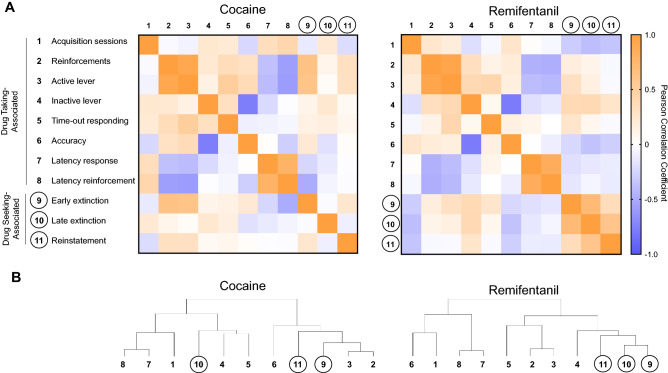
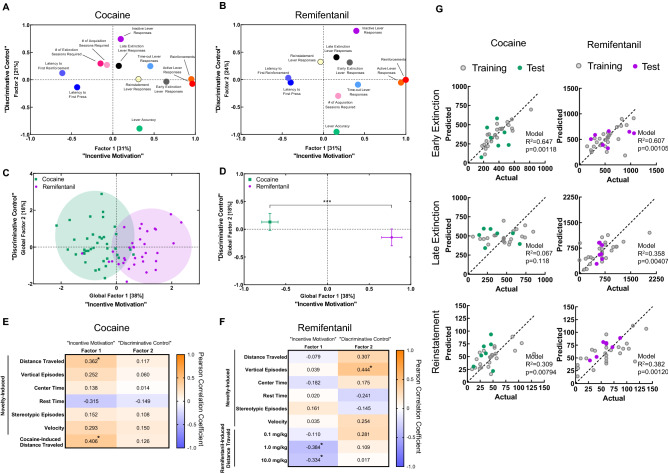
Genetically tractable animal models provide needed strategies to resolve the biological basis of drug addiction. Intravenous self-administration (IVSA) is the gold standard for modeling psychostimulant and opioid addiction in animals, but technical limitations have precluded the widespread use of IVSA in mice. Here, we describe IVSA paradigms for mice that capture the multi-stage nature of the disorder and permit predictive modeling. In these paradigms, C57BL/6J mice with long-standing indwelling jugular catheters engaged in cocaine- or remifentanil-associated lever responding that was fixed ratio-dependent, dose-dependent, extinguished by withholding the drug, and reinstated by the presentation of drug-paired cues. The application of multivariate analysis suggested that drug taking in both paradigms was a function of two latent variables we termed incentive motivation and discriminative control. Machine learning revealed that vulnerability to drug seeking and relapse were predicted by a mouse's a priori response to novelty, sensitivity to drug-induced locomotion, and drug-taking behavior. The application of these behavioral and statistical-analysis approaches to genetically-engineered mice will facilitate the identification of neural circuits driving addiction susceptibility and relapse and focused therapeutic development.


Conflict of interest statement

The authors declare no competing interests.

Figures

Figure 1
Figure 1
Long-lasting jugular catheters and low attrition permit longitudinal, multi-stage intravenous self-administration in mice. (A) Recovery from jugular catheterization procedure. Percent and number (n) of mice that met survival and health criteria on post-catheterization day 7. (B) Success of jugular catheter placement. Percent and number (n) of all animals that passed a test of catheter patency on post-catheterization day 7. (C) Attrition over the study due to animals meeting designated health endpoints. Animals were removed from the study when they displayed signs of deteriorating health. The median time in the study (i.e., survival) exceeded 100 days. (D) Attrition over the study due to loss of catheter patency. Cather patency was followed throughout the study. The catheters of animals removed from the study for health reasons were considered patent unless they had a documented patency test failure. The median catheter patency life was ≥ 100 days. (E) Overview of study design. Mice with indwelling jugular catheters underwent behavioral testing in the open field and were then trained to self-administer drugs paired with a cue light via lever responding in operant chambers. For the details of the contingent advancement training and testing paradigms, see Figs. S1 and S2.
Figure 2
Figure 2
Acquisition of cocaine and remifentanil self-administration. Mice with indwelling jugular catheters were trained to self-administer iv cocaine (0.5 mg/kg/infusion) or remifentanil (0.1 mg/kg/infusion) by lever responding in operant chambers n FR1, FR2, and FR4 schedules. Group means ± SEM are represented by solid green (cocaine) or purple (remifentanil) lines and individual replicates by dashed lines. Note, solid gray lines represent the vehicle. (A,C) Acquisition success rates. Percent of animals with patent catheters that acquired or failed to acquire iv cocaine (A) or remifentanil (C) self-administration at FR4 using contingent advancement protocols. (B,D) Sessions to self-administration acquisition. Frequency plot of the number of sessions required to meet final cocaine (B) or remifentanil (D) self-administration acquisition criteria at FR4. The minimum session requirements and group means are indicated by dashed vertical lines. (E,F). Lever responses by acquisition session type. Lever responses by mice that acquired cocaine (E) or remifentanil (F) self-administration. Data are presented from the first sessions of each session type, as indicated. Two levers were always available in the chamber. During 2-lever training sessions both levers were active and resulted in a drug delivery. In 1-lever training sessions, one lever was designated active and the other inactive. The non-preferred lever in the final 2 active lever session became the active lever in the first 1-lever training session. The active lever was retained for individual mice for the duration of the study. In FR1 sessions, the mouse had to press an active lever once to receive a drug infusion. In FR2 sessions, the mouse had to press the active lever twice to receive a drug infusion. In FR4 sessions, the mouse had to press the active lever four times to receive a drug infusion. (G,I) Active lever responses. Total active lever presses by mice self-administering cocaine (G) or remifentanil (I) at FR1, FR2, and FR4. Responses include both those that contributed to earned reinforcements and those that occurred during the post-reinforcement time-out period. (H,J) Inactive lever responses. Total inactive lever presses by mice self-administering cocaine (H) or remifentanil (J) at FR1, FR2, and FR4. (K,M) Lever accuracy. Percent of total lever responses that occurred at the designated active lever by mice self-administering cocaine (K) or remifentanil (M) at FR1, FR2, and FR4. (L,N) Reinforcements. Earned reinforcements by mice self-administering cocaine (L) or remifentanil (N) at FR1, FR2, and FR4. For details on statistical comparisons, see Tables S2, S3. For the experimental designs, see Figs. S1, S2.
Figure 3
Figure 3
Dose–response relationships for cocaine and remifentanil self-administration behaviors. Stable self-administration of cocaine at FR4 was assessed in 60 min sessions at doses of 0.1, 0.3, 0.5, 1.0, and 3.0 mg/kg/infusion. Stable self-administration of remifentanil at FR4 was assessed in 60 min sessions at doses of 0.01, 0.03, 0.1, 0.3, 1.0, and 3.0 mg/kg/infusion. Ranges of axes were selected to emphasize curve fits and differences by drug class. Data are represented as mean ± SEM. (A,I) Reinforcements. Earned reinforcements versus log cocaine (A) or remifentanil (I) dose. Data were fit to a second order polynomial curve. (B,J) Active lever responses. Active lever presses versus log cocaine (B) or remifentanil (J) dose. Responses include both those that contributed to earned reinforcements and those that occurred during the post-reinforcement time-out period. Data were fit to a second order polynomial curve. (C,K) Inactive lever responses. Inactive lever presses versus log cocaine (C) or remifentanil (K) dose. Data were fit to a straight line. (D,L) Drug intake. Cocaine (D) or remifentanil (L) consumed versus log drug dose. Cocaine data were fit to a sigmoidal curve. Remifentanil data were fit to an exponential growth curve. (E,M) Lever accuracy. Percent of total lever responses that occurred at the designated active lever versus log cocaine (E) or remifentanil (M) dose. Data were fit to a straight line. (F,N) Latency to first lever response. Time from the start of the session until the first lever response versus log cocaine (F) or remifentanil (N) dose. Data were fit to a straight line. (G,O) Latency to first earned reinforcement. Time from the start of the session until the first earned reinforcement versus log cocaine (G) or remifentanil (O) dose. Data were fit to a straight line. (H,P) Post-reinforcement time-out responses. Total number of lever responses that occurred during the post-reinforcement time-out periods versus log cocaine (H) or remifentanil (P) dose. Data were fit to a straight line. For information on curve fits, see Table S4. Also see Figs. S4, S5, S6.
Figure 4
Figure 4
Extinction and cue-induced reinstatement of cocaine- and remifentanil-associated lever responding. In mice trained to self-administer cocaine or remifentanil at FR4, drug-associated lever responding was extinguished in consecutive sessions in which drugs and cues were withheld and subsequently reinstated by the reintroduction of the drug-paired cues. Data are represented as mean ± SEM. (A,E) Active and inactive lever responses during extinction. Active and inactive lever responding is presented by extinction session number for mice in the cocaine (A) and remifentanil (E) paradigms. Lever responding for 1 mg/kg/infusion of drug (i.e., self-administration, SA) is included for reference. (B,F) Total lever responses during extinction. Total lever responding is presented by extinction session number in gray bars for mice in the cocaine (B) and remifentanil (F) paradigms. Colored curves are one-phase exponential decay fits. (C,G) Lever accuracy at maintenance SA to first extinction session, at the first and final extinction sessions, and at the final extinction session and reinstatement. The percent of total lever responses occurring at the active lever is presented by session type for mice in the cocaine (C) and remifentanil (G) paradigms. SA indicates accuracy during the 1.0 mg/kg/infusion drug maintenance active self-administration session. (D,H) Active and inactive lever responses during SA, extinction, and reinstatement. Active and inactive lever responding is presented by session type for mice in the cocaine (D) and remifentanil (H) paradigms. SA indicates lever responding during the 1.0 mg/kg/infusion drug active self-administration session. Group means are represented by colored bars and individual values are shown as gray circles. For curve parameters and details on statistical comparisons, see Table S5.
Figure 5
Figure 5
Relationships between drug taking- and drug seeking-associated self-administration variables. Drug taking- and drug seeking-associated variables are numbered according to the key on the far left. Numbers assigned to drug seeking-associated variables are enclosed in circles. (A) Heat maps of Pearson R correlation coefficients and corresponding p-values. The increasing saturation of orange and blue colors correspond to increasing absolute values of positive and negative Pearson correlation coefficients, respectively. The increasing saturation of green color corresponds to decreasing p-values. White indicates a correlation coefficient close to 0 and p-value close to 0.4. (B) Dendrograms. Results of hierarchical clustering. Correlation coefficient values and corresponding p-values are provided in Tables S6 and S7.
Figure 6
Figure 6
Feature discovery and predictive modeling of self-administration behaviors. (A,B) Variable factor loading. Factor loading plots for self-administration variables included in exploratory factor analyses for cocaine (A) and remifentanil (B). (C) Global factor scores. Factor scores for individual animals, obtained using regression, are represented as squares or circles. Ovals are drawn around animals in each drug/reinforcer paradigm. Each oval encompasses the genotype mean and contacts the closest 80% of individual values. (D) Comparison of factor scores by reinforcer. Factor scores for components 1 and 2 were averaged by drug paradigm and compared using unpaired, two-tailed student’s t-tests. Data are represented as mean ± SEM. For component 1: [t(70) = 9.4, p < 0.0001]. For component 1: [t(70) = 1.3, p = 0.2082]. (E,F) Heat maps of Pearson correlation coefficients for open field variables and factor scores. Correlation coefficients for cocaine (E) and remifentanil (F) are shown on top for heat maps in which the increasing saturation of orange and blue colors correspond to increasing absolute values for positive and negative Pearson correlation coefficients, respectively. Significant values are indicated by an asterisk. *p < 0.05. (G) Actual versus predicted plots for multiple linear regression models constructed for drug seeking during early extinction (top), late extinction (middle), and reinstatement (bottom) based on responses to novelty, drug-induced hyperlocomotion, and drug-taking behaviors. For factor loadings, see Table S8. For information on variables included in the regression models and details on model performance, see Tables S9, S10 and S11, and Figure S8.

References

    1. Wilson N, Kariisa M, Seth P, Smith HT, Davis NL. Drug and opioid-involved overdose deaths—United States, 2017–2018. MMWR Morb. Mortal Wkly. Rep. 2020;69:290–297. doi: 10.15585/mmwr.mm6911a4. - DOI - PMC - PubMed
    1. Florence CS, Zhou C, Luo F, Xu L. The economic burden of prescription opioid overdose, abuse, and dependence in the United States, 2013. Med. Care. 2016;54:901–906. doi: 10.1097/MLR.0000000000000625. - DOI - PMC - PubMed
    1. Hedegaard H, Bastian BA, Trinidad JP, Spencer M, Warner M. Drugs most frequently involved in drug overdose deaths: United States, 2011–2016. Natl. Vital Stat. Rep. 2018;69:1–13. - PubMed
    1. Volkow ND, Koob GF, McLellan AT. Neurobiologic advances from the brain disease model of addiction. N. Engl. J. Med. 2016;374:363–371. doi: 10.1056/NEJMra1511480. - DOI - PMC - PubMed
    1. Deneau G, Yanagita T, Seevers MH. Self-administration of psychoactive substances by the monkey. Psychopharmacologia. 1969;16:30–48. doi: 10.1007/BF00405254. - DOI - PubMed