

Qualitative and quantitative phytochemical screening of Nerium oleander L. extracts associated with toxicity profile
- PMID: 36504046
- PMCID: PMC9742154
- DOI: 10.1038/s41598-022-26087-0
Qualitative and quantitative phytochemical screening of Nerium oleander L. extracts associated with toxicity profile
Abstract
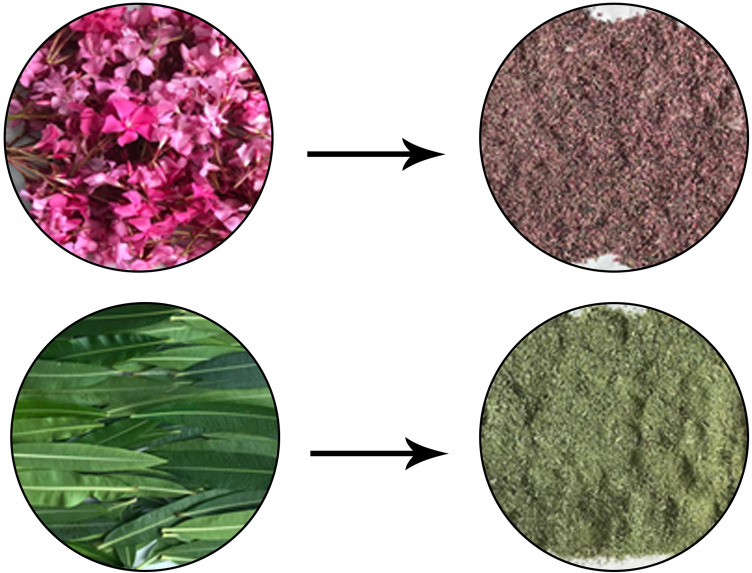
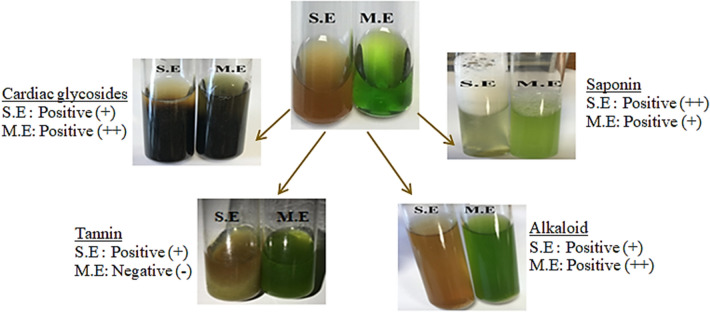
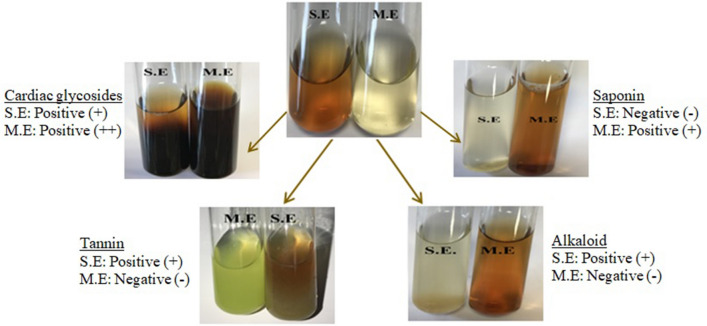
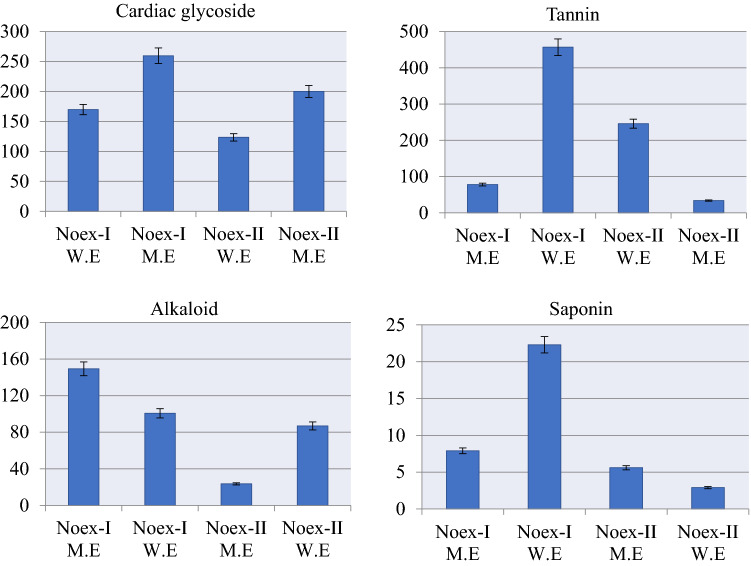
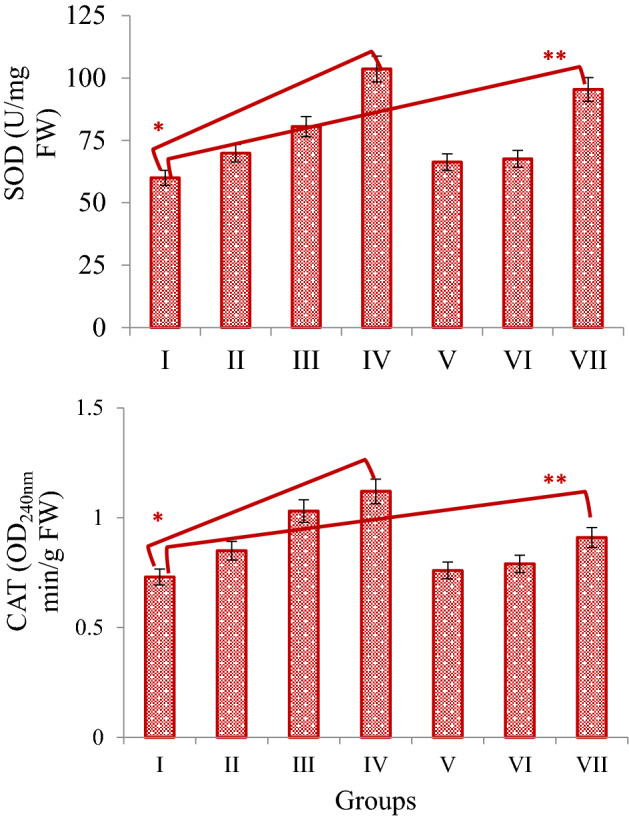
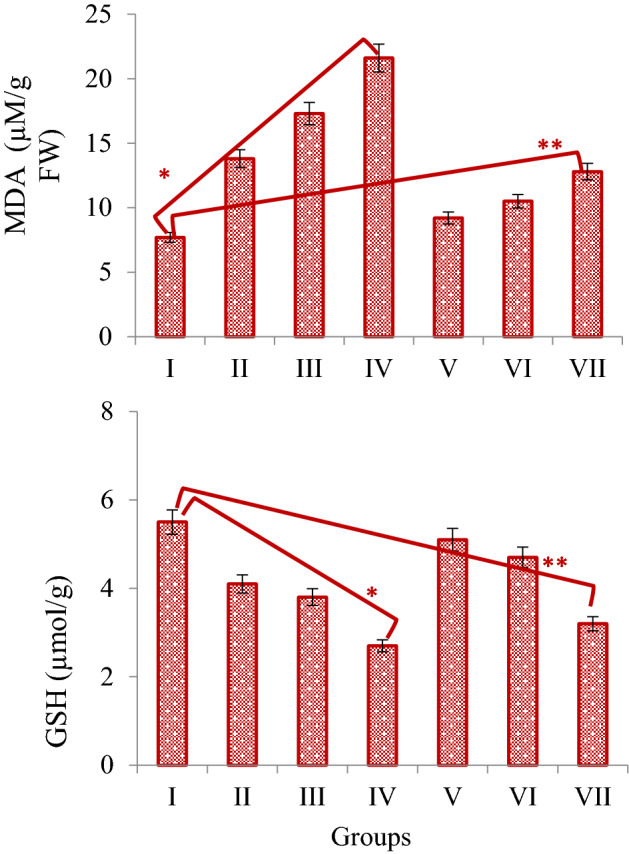
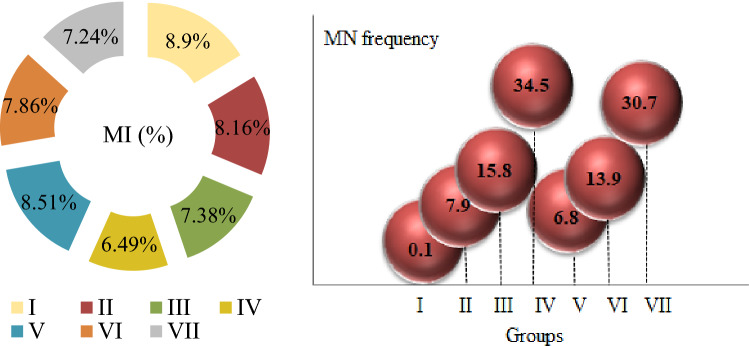
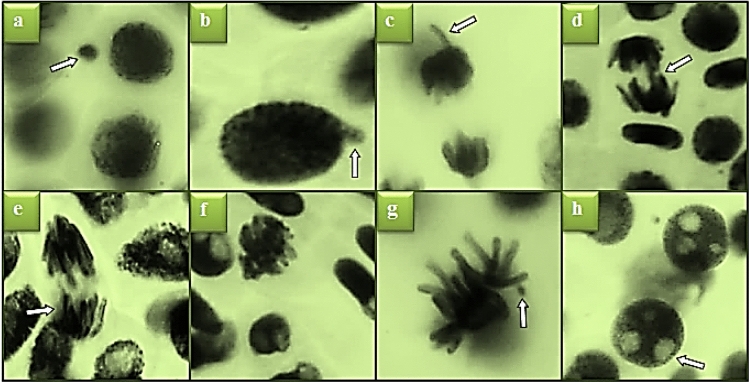
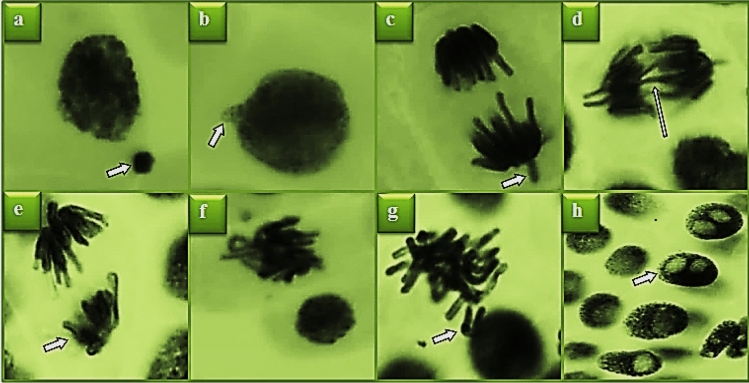
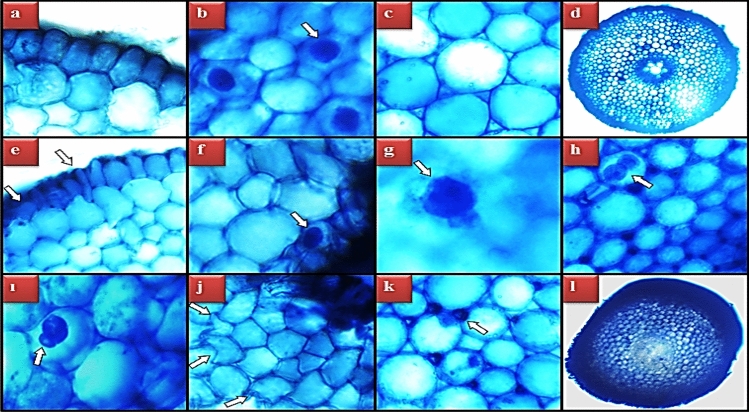
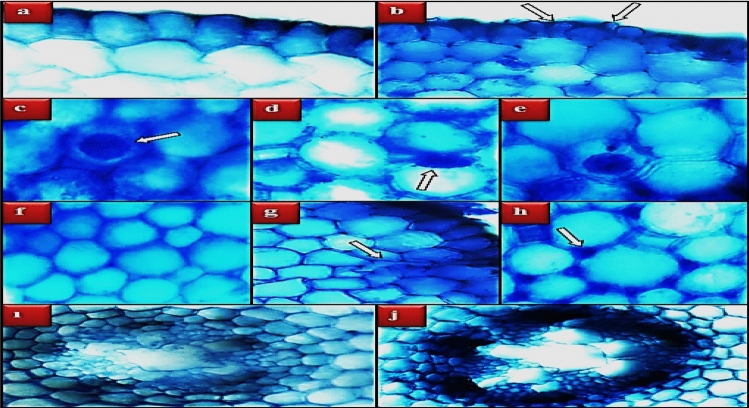
In this study, phytochemical analysis and toxicity profile of leaf and flower extracts of Nerium oleander L. species collected from Giresun province (Turkey) were investigated. In phytochemical analyzes, the cardiac glycoside, alkaloid, saponin and tannin contents of the extracts were analyzed qualitatively and quantitatively. The physiological effects of extracts were determined by examining root elongation, weight gain and germination rates. Biochemical effects were determined by measuring the levels of malondialdehyde (MDA), glutathione (GSH), superoxide dismutase (SOD) and catalase (CAT), which are indicators of oxidative stress. Cytotoxic and genotoxic effects were investigated by mitotic index (MI), micronucleus (MN) and chromosomal abnormality (CA) tests. N. oleander leaf and flower extract applications caused significant decreases in the physiological parameters of Allium bulbs. SOD and CAT activity in root tip cells increased significantly after the application of leaf extract compared to the control group. Similar changes were observed in the application of flower extract, but these increases were found to be at a lower level compared to the increases induced by the leaf extract. An increase in MDA levels and a decrease in GSH levels were observed in groups treated with leaf and flower extracts. These changes show that the extracts cause deterioration in antioxidant/oxidant balance. It was determined that the extracts, which caused a decrease in MI rates and an increase in MN and CAs frequencies, showed the most prominent cytotoxic and genotoxic effects at 250 μg/mL doses. These toxic effects were associated with the phytochemical content of the extracts, and it was thought that cardiac glycosides and alkaloids, whose presence were detected in qualitative and quantitative analyzes, may play an important role in toxicity. Studies investigating the therapeutic properties of plants as well as their toxic effects are insufficient, which leads to the fact that plants exhibiting potential toxicity are not well known. Therefore, this study will lead many studies on the toxicity profile of the phytochemical contents of plants. Therefore, this study will draw attention to the investigation of the toxicity profile and phytochemical contents of plants and will lead to similar studies.
© 2022. The Author(s).
Conflict of interest statement
The authors declare no competing interests.
Figures
Similar articles
-
GC-MS and HPLC supported phytochemical analysis of watercress and the protective role against paraben toxicity.Environ Sci Pollut Res Int. 2023 Jan;30(3):6033-6046. doi: 10.1007/s11356-022-22380-7. Epub 2022 Aug 20. Environ Sci Pollut Res Int. 2023. PMID: 35986852
-
Metal chelating and anti-radical activity of Salvia officinalis in the ameliorative effects against uranium toxicity.Sci Rep. 2022 Sep 23;12(1):15845. doi: 10.1038/s41598-022-20115-9. Sci Rep. 2022. PMID: 36151120 Free PMC article.
-
Comprehensive toxicity screening of Pazarsuyu stream water containing heavy metals and protective role of lycopene.Sci Rep. 2022 Oct 5;12(1):16615. doi: 10.1038/s41598-022-21081-y. Sci Rep. 2022. PMID: 36198753 Free PMC article.
-
Dose-dependent toxicity profile and genotoxicity mechanism of lithium carbonate.Sci Rep. 2022 Aug 5;12(1):13504. doi: 10.1038/s41598-022-17838-0. Sci Rep. 2022. PMID: 35931740 Free PMC article.
-
A toxic shrub turned therapeutic: The dichotomy of Nerium oleander bioactivities.Toxicon. 2023 Mar 1;224:107047. doi: 10.1016/j.toxicon.2023.107047. Epub 2023 Jan 25. Toxicon. 2023. PMID: 36706925 Review.
Cited by
-
Antioxidant content following fermentation of lemongrass for herbal beverage development.J Food Sci Technol. 2024 Dec;61(12):1-14. doi: 10.1007/s13197-024-06005-0. Epub 2024 May 30. J Food Sci Technol. 2024. PMID: 39431189
-
Neem (Azadirachta indica) leaf extract mediated synthesis of zinc oxide nanoparticles (ZnO NPs) and their antibacterial activity.Discov Nano. 2025 Aug 22;20(1):145. doi: 10.1186/s11671-025-04260-4. Discov Nano. 2025. PMID: 40844683 Free PMC article.
-
Potential Anti-Tumorigenic Properties of Diverse Medicinal Plants against the Majority of Common Types of Cancer.Pharmaceuticals (Basel). 2024 Apr 30;17(5):574. doi: 10.3390/ph17050574. Pharmaceuticals (Basel). 2024. PMID: 38794144 Free PMC article. Review.
-
Floral Fusion: Unravelling the Potent Blend of Ixora coccinea and Rhododendron arboreum for Health and Safety Benefits.Cureus. 2024 Sep 23;16(9):e70038. doi: 10.7759/cureus.70038. eCollection 2024 Sep. Cureus. 2024. PMID: 39449919 Free PMC article.
-
LC-MS/MS, GC-MS and molecular docking analysis for phytochemical fingerprint and bioactivity of Beta vulgaris L.Sci Rep. 2024 Mar 29;14(1):7491. doi: 10.1038/s41598-024-58338-7. Sci Rep. 2024. PMID: 38553576 Free PMC article.
References
-
- Leicach SR, Chludil HD. Plant secondary metabolites: Structure–activity relationships in human health prevention and treatment of common diseases. Stud. Nat. Prod. Chem. 2014;42:267–304. doi: 10.1016/B978-0-444-63281-4.00009-4. - DOI
-
- Twaij BM, Hasan MN. Bioactive secondary metabolites from plant sources: Types, synthesis, and their therapeutic uses. Int. J. Plant Biol. 2022;13(1):4–14. doi: 10.3390/ijpb13010003. - DOI
-
- Bhutani KK, Gohil VM. Natural products drug discovery research in India: Status and appraisal. Indian J. Exp. Biol. 2010;48:199–207. - PubMed
MeSH terms
Substances
LinkOut - more resources
Full Text Sources
Miscellaneous
