

ST3GAL5-catalyzed gangliosides inhibit TGF-β-induced epithelial-mesenchymal transition via TβRI degradation
- PMID: 36504224
- PMCID: PMC9841337
- DOI: 10.15252/embj.2021110553
ST3GAL5-catalyzed gangliosides inhibit TGF-β-induced epithelial-mesenchymal transition via TβRI degradation
Abstract
Epithelial-mesenchymal transition (EMT) is pivotal in the initiation and development of cancer cell metastasis. We observed that the abundance of glycosphingolipids (GSLs), especially ganglioside subtypes, decreased significantly during TGF-β-induced EMT in NMuMG mouse mammary epithelial cells and A549 human lung adenocarcinoma cells. Transcriptional profiling showed that TGF-β/SMAD response genes and EMT signatures were strongly enriched in NMuMG cells, along with depletion of UDP-glucose ceramide glucosyltransferase (UGCG), the enzyme that catalyzes the initial step in GSL biosynthesis. Consistent with this finding, genetic or pharmacological inhibition of UGCG promoted TGF-β signaling and TGF-β-induced EMT. UGCG inhibition promoted A549 cell migration, extravasation in the zebrafish xenograft model, and metastasis in mice. Mechanistically, GSLs inhibited TGF-β signaling by promoting lipid raft localization of the TGF-β type I receptor (TβRI) and by increasing TβRI ubiquitination and degradation. Importantly, we identified ST3GAL5-synthesized a-series gangliosides as the main GSL subtype involved in inhibition of TGF-β signaling and TGF-β-induced EMT in A549 cells. Notably, ST3GAL5 is weakly expressed in lung cancer tissues compared to adjacent nonmalignant tissues, and its expression correlates with good prognosis.
Keywords: ST3GAL5; UDP-glucose ceramide glucosyltransferase; epithelial-mesenchymal transition; glycosphingolipids; transforming growth factor-β.
© 2022 The Authors. Published under the terms of the CC BY NC ND 4.0 license.
Figures
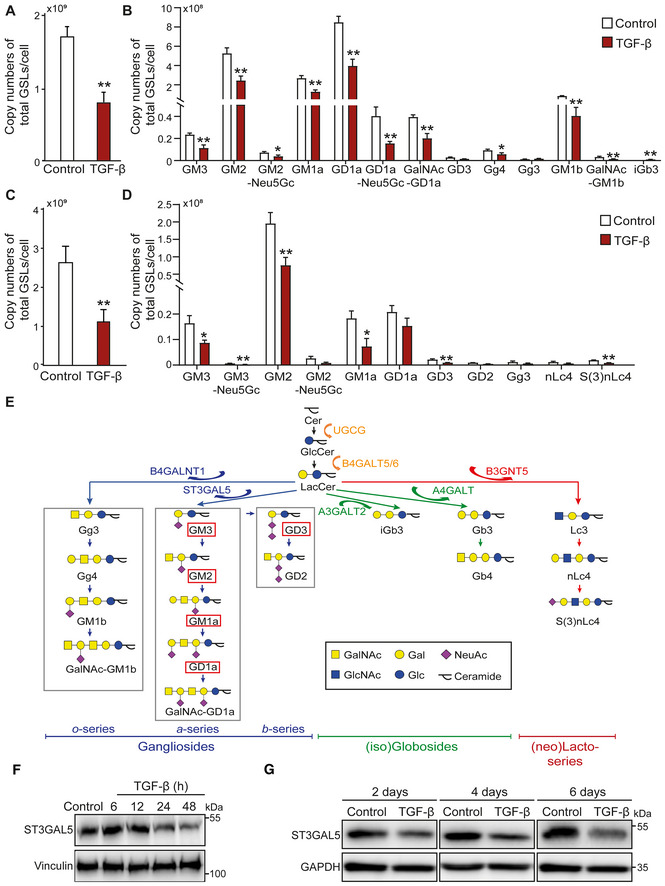
- A, B
Average copy numbers of (A) total GSL‐glycans and (B) individual GSL‐glycans per cell in NMuMG cells stimulated with TGF‐β.
- C, D
Average copy numbers of (C) total GSL‐glycans and (D) individual GSL‐glycans per cell in A549‐VIM‐RFP cells treated with TGF‐β.
- E
GSL biosynthesis scheme. GSLs present in both NMuMG cells, and A549‐VIM‐RFP cells are highlighted by red boxes.
- F, G
Immunoblot analysis of ST3GAL5 in (F) NMuMG and (G) A549‐VIM‐RFP cells treated with vehicle control or TGF‐β for the indicated time. Vinculin and GAPDH: loading controls.
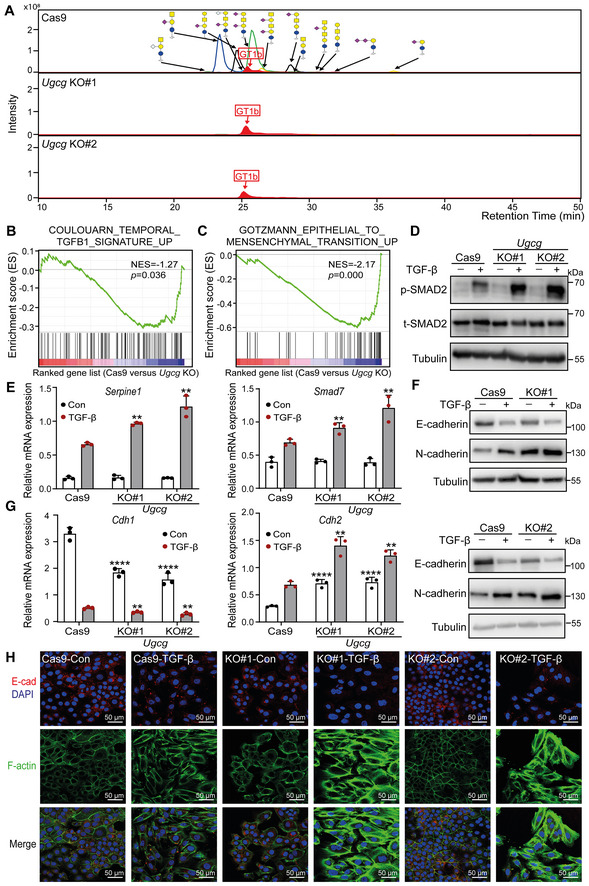
Combined extracted ion chromatography of GSL glycans in Ugcg KO and control NMuMG cells. GT1b: internal normalization control.
Mouse TGF‐β gene signatures were enriched in Cas9 control versus Ugcg KO NMuMG cells, as shown by GSEA. Normalized enrichment score (NES) = −1.27, P = 0.036.
GSEA of mouse EMT gene signatures in Cas9 control versus Ugcg KO NMuMG cells. NES = −2.17, P = 0.000.
Immunoblot analysis of p‐SMAD2 and total SMAD2 (t‐SMAD2) in NMuMG cells with or without Ugcg deficiency and treated with vehicle control or TGF‐β for 1 h. Tubulin: loading control.
qRT–PCR analysis of TGF‐β target genes, including Serpine1 and Smad7, in Ugcg KO NMuMG or control NMuMG cells treated with vehicle control or TGF‐β for 6 h.
Immunoblot analysis of E‐cadherin and N‐cadherin in Ugcg KO NMuMG or control NMuMG cells treated with vehicle control or TGF‐β for 48 h. Tubulin: loading control.
Cdh1 and Cdh2 mRNA levels in Ugcg KO or control NMuMG cells after vehicle control or TGF‐β treatment for 48 h.
Immunofluorescence analysis of the expression and localization of E‐cadherin (red) and the formation of F‐actin (green) after treatment with vehicle control or TGF‐β for 2 days. Nuclei were counterstained with DAPI (blue). Images were acquired with confocal microscopy. Scale bar = 50 μm.
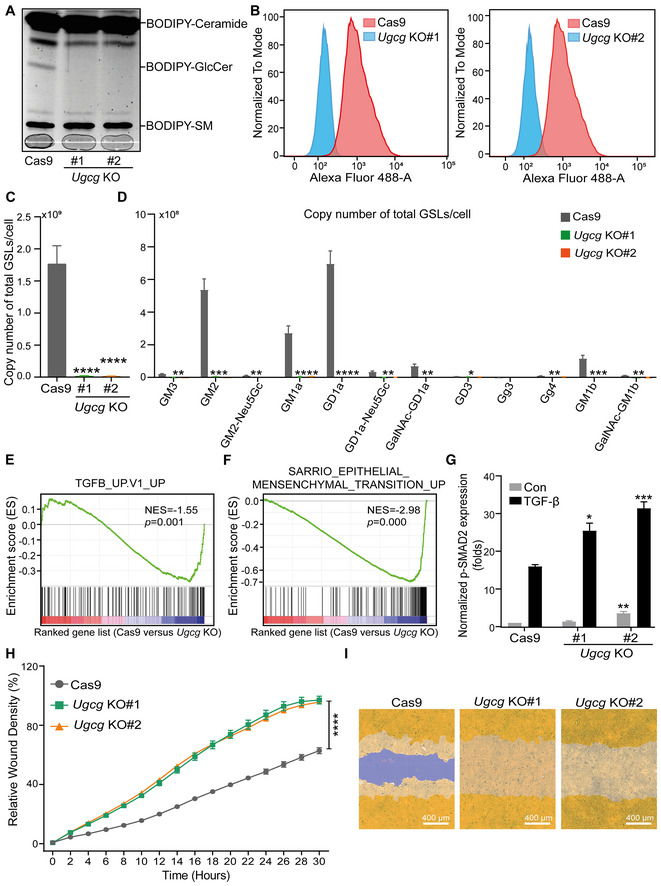
Analysis of BODIPY‐conjugated ceramide, GlcCer, and sphingomyelin (SM) in two independent Ugcg KO NMuMG cell lines and the control NMuMG cell line using TLC. The light gray line at the bottom of the gel (that is marked with a pencil) was used to indicate the running lanes during the experiment (and where the samples were loaded).
Detection of GM1 ganglioside by flow cytometry using Alexa Fluor 488‐conjugated CTB in two Ugcg KO (KO#1 and KO#2) NMuMG cell lines infected with one guide RNA and a Cas9 expression vector or with a Cas9 expression vector alone (control).
Average absolute quantities of total GSL‐glycans per cell in NMuMG cells with Ugcg KO.
Average absolute quantities of individual GSL‐glycans per cell in NMuMG cells with Ugcg KO.
The human TGF‐β gene response signature was enriched in Cas9 control versus Ugcg KO NMuMG cells, as shown by GSEA. NES = −1.55, P = 0.001.
GSEA of the human EMT gene signature enriched in Cas9 control versus Ugcg KO NMuMG cells. NES = −2.98, P = 0.000.
Quantification of the p‐SMAD2 level in NMuMG cells, including the Cas9 group and the Ugcg KO groups with and without TGF‐β (2.5 ng/ml) treatment for 1 h. Tubulin: loading control.
The time course of wound closure in NMuMG cells with or without Ugcg deficiency was analyzed by an IncuCyte system.
Representative images of a scratch wound at the final time point (30 h) in the control group and two Ugcg KO groups of NMuMG cells. The region of the original scratch is indicated in purple, and the region of the cell is colored yellow. Scale bar = 400 μm.
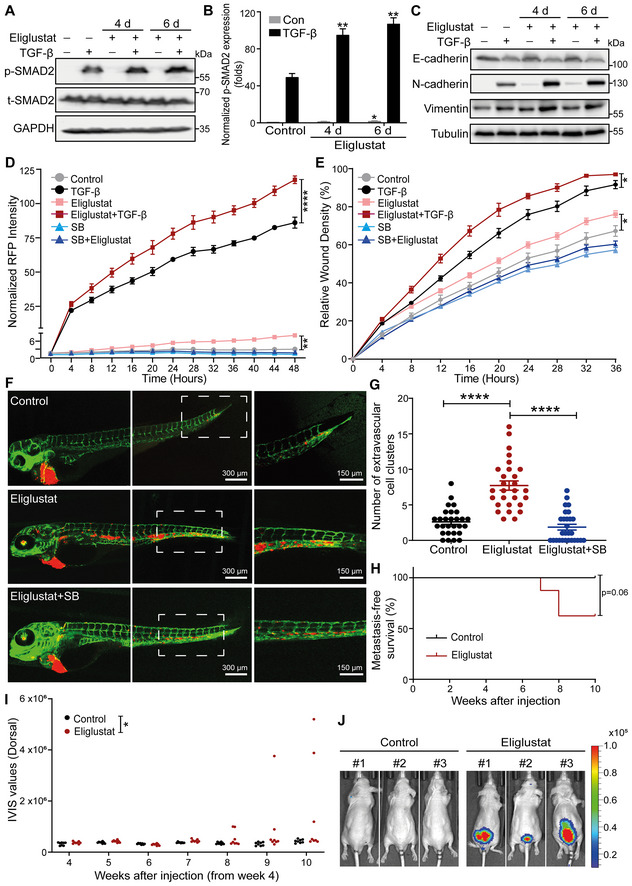
Immunoblot analysis of p‐SMAD and t‐SMAD2 in A549‐VIM‐RFP cells pretreated with eliglustat for 4 or 6 days and then treated with vehicle control or TGF‐β for 1 h. GAPDH: loading control.
Quantification of the p‐SMAD2 level in A549‐VIM‐RFP cells as shown in (A). The levels were normalized to that of GAPDH, and fold changes were then further normalized to the level of p‐SMAD2 in control cells without TGF‐β treatment.
Immunoblot analysis of the epithelial marker E‐cadherin and mesenchymal markers N‐cadherin and vimentin in A549‐VIM‐RFP cells treated with eliglustat for 4 or 6 days and/or with vehicle control and/or TGF‐β for 2 days. Tubulin: loading control.
Effect of eliglustat (pre)treatment for 4 days on vimentin expression in A549‐VIM‐RFP cells in response to TGF‐β and/or SB505124 (SB, 1 μM) treatment for the indicated times. The time course of RFP‐tagged vimentin expression was monitored with IncuCyte. The red object intensity was normalized to the red intensity at 0 h.
A549‐VIM‐RFP cells were pretreated with eliglustat for 4 days and were then incubated with TGF‐β or SB505124 (SB, 1 μM) for the indicated times. The real‐time scratch assay results were analyzed with an IncuCyte system.
mCherry‐labeled A549 cells were pretreated with eliglustat (2 μM) for 4 days and were then injected into ducts of Cuvier of zebrafish embryos. Representative images with magnified regions (outlined with dotted squares) of extravasated cells were acquired 4 days after injection by confocal microscopy. SB group zebrafish were treated with the inhibitor SB505124 (1 μM) in the egg water together with eliglustat for 4 days after injection with daily refreshment of the treatments. Scale bar = 300 or 150 μm.
Quantification of the number of extravasated cell clusters from 28 embryos per group. ****P < 0.0001 based on unpaired Student's t‐test from two biological replicates (n = 2).
Kaplan–Meier analysis of metastasis‐free survival in eight mice in the group injected with untreated A549‐Luc cells and eight mice injected with cells pretreated with eliglustat for 1 week. The log‐rank test was used for statistical analysis; P = 0.06.
Analysis of the in vivo imaging system (IVIS) values from the fourth week post‐injection in eight mice in the control group and eight mice in the eliglustat pretreatment group.
Whole‐body bioluminescence images (BLI) at 10 weeks of three mice injected with untreated A549‐Luc cells or cells pretreated with eliglustat for 1 week. BLI of all eight mice in each group are shown in Appendix Fig S4E.
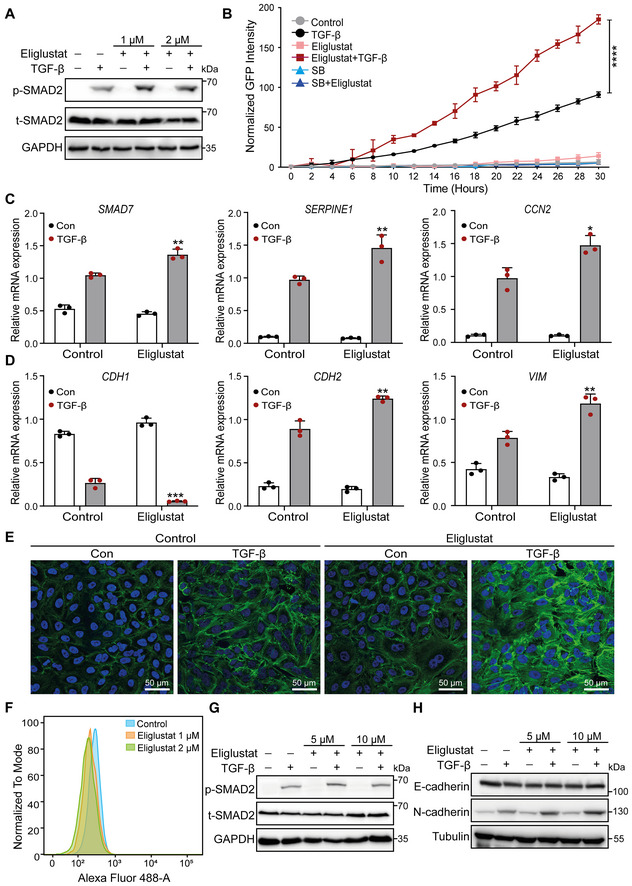
Levels of p‐SMAD2 and t‐SMAD2 in A549‐VIM‐RFP cells pretreated with eliglustat (1 or 2 μM) for 4 days and then treated with TGF‐β or vehicle control for another 2 days, as shown by immunoblot analysis. GAPDH: loading control.
Effect of eliglustat (2 μM) (pre)treatment for 4 days on SMAD3/SMAD4‐dependent (CAGA)12‐mediated transcriptional GFP reporter expression levels in A549‐VIM‐RFP cells transduced with the CAGA‐GFP lentiviral vector and treated with TGF‐β and/or SB505124 (SB, 1 μM) for the indicated times. The time course of the GFP signal was monitored with an IncuCyte system. The GFP object intensity was normalized to the green intensity at 0 h.
qRT–PCR analysis of TGF‐β target genes, including SMAD7, SERPINE1 and CCN2, in A549‐VIM‐RFP cells pretreated with eliglustat (2 μM) for 6 days and then treated with vehicle control or TGF‐β for 6 h.
CDH1, CDH2, and VIM mRNA levels in A549‐VIM‐RFP cells pretreated with eliglustat (2 μM) for 6 days and then treated with vehicle control or TGF‐β for 6 h.
Alexa Fluor 488 phalloidin staining of F‐actin (green) in A549‐VIM‐RFP cells pretreated with eliglustat (2 μM) for 4 days and then treated with vehicle control or TGF‐β for 48 h. Nuclei were counterstained with DAPI (blue). Images were acquired with confocal microscopy. Scale bar = 50 μm.
Detection of GM1 ganglioside expression in NMuMG cells upon treatment with eliglustat (1 or 2 μM) for 4 days, as analyzed by flow cytometry using Alexa Fluor 488‐conjugated CTB.
Immunoblot analysis of p‐SMAD2 and t‐SMAD2 in NMuMG cells treated with eliglustat (5 or 10 μM) for 4 days and with vehicle control and/or TGF‐β for 1 h. GAPDH: loading control.
Western blot analysis of the expression of the epithelial marker E‐cadherin and mesenchymal marker N‐cadherin in NMuMG cells (pre) treated with eliglustat (5 or 10 μM) for 4 days and with vehicle control and/or TGF‐β for 2 days. Tubulin: loading control.
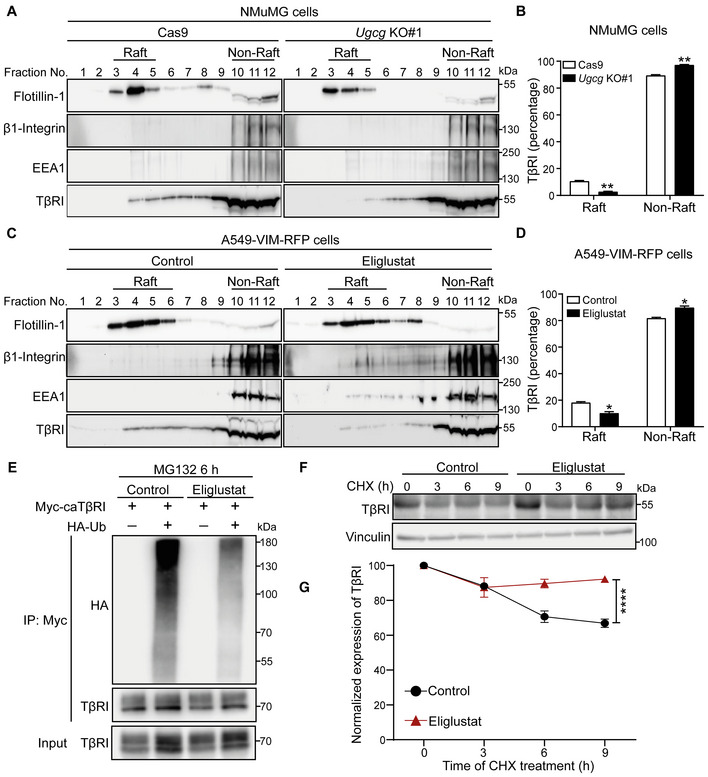
Lysates from NMuMG control cells (Cas9‐expressing cells) and Ugcg KO cells were subjected to sucrose density gradient ultracentrifugation. The expression levels of flotillin‐1, β1‐integrin, EEA1, and TβRI in the sucrose gradient fractions were analyzed by immunoblotting. Fractions 3, 4, and 5 contained lipid rafts, whereas fractions 10–12 corresponded to the non‐lipid raft fractions.
Quantification of TβRI percentages in lipid raft and non‐lipid raft fractions from Ugcg KO NMuMG and control cells.
Isolation of lipid rafts from other cellular components in A549‐VIM‐RFP cells treated with the UGCG inhibitor eliglustat (2 μM) for 6 days using sucrose density gradient ultracentrifugation and measurement of flotillin‐1, β1‐integrin, EEA1, and TβRI levels in the sucrose gradient fractions using immunoblot analysis. Fractions 3–6 contained lipid rafts, whereas fractions 10–12 corresponded to the non‐lipid raft fractions.
Quantification of TβRI percentages in lipid raft and non‐lipid raft fractions from A549‐VIM‐RFP cells treated with eliglustat (2 μM) for 6 days.
Ubiquitination of TβRI was detected by immunoprecipitation (IP) of Myc‐tagged caTβRI from HA‐Ub‐transfected HEK293T cells with or without eliglustat (2 μM) treatment for 6 days. All groups were treated with MG132 (5 μM) for 6 h.
Immunoblot analysis of TβRI expression levels in control and eliglustat (2 μM)‐treated A549‐VIM‐RFP cells treated with 50 μg/ml CHX for the indicated times. Vinculin: loading control.
Quantification of TβRI expression levels with normalization to the t = 0 controls.
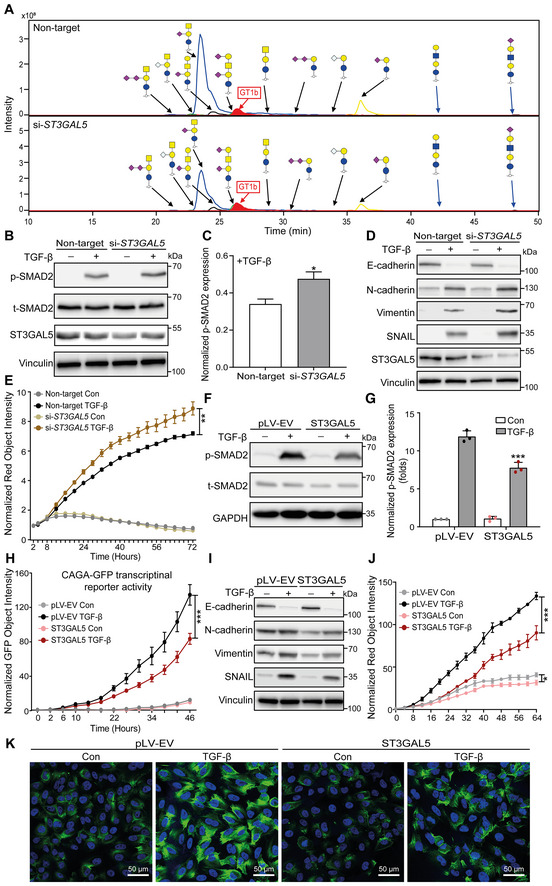
Extracted ion chromatograms of GSL‐glycans released from A549‐VIM‐RFP cells transfected with nontargeting, ST3GAL5 or B4GALNT1 siRNA. GT1b: internal normalization control.
Immunoblot analysis of p‐SMAD2, t‐SMAD2, and ST3GAL5 in A549‐VIM‐RFP cells with siRNA‐mediated ST3GAL5 knockdown or transfection of nontargeting siRNA and treated with vehicle control or TGF‐β for 1 h. Vinculin: loading control.
Quantification of the p‐SMAD2 level in A549‐VIM‐RFP cells transfected with nontargeting or ST3GAL5 siRNA and treated with TGF‐β as shown in (B).
Expression levels of ST3GAL5, the epithelial marker E‐cadherin, and mesenchymal markers, including N‐cadherin, vimentin, and SNAIL, in siRNA ST3GAL5‐depleted and nontargeting siRNA‐transfected A549‐VIM‐RFP cells treated with vehicle control or TGF‐β for 48 h. Vinculin: loading control.
The time course of RFP‐tagged vimentin expression was monitored with an IncuCyte system in siRNA ST3GAL5 knockdown and nontargeting siRNA‐transfected A549‐VIM‐RFP cells treated with vehicle control or TGF‐β for the indicated times. The red object intensity was normalized to the red intensity at 0 h.
Immunoblot analysis of p‐SMAD2 and t‐SMAD2 in A549‐VIM‐RFP cells transduced with empty vector (pLV‐EV) or the ST3GAL5 expression construct and stimulated with vehicle control or TGF‐β for 1 h. GAPDH: loading control.
Quantification of the p‐SMAD2 level in A549‐VIM‐RFP cells transduced with pLV‐EV or the ST3GAL5 overexpression construct and treated with TGF‐β, as shown in (F).
A549‐VIM‐RFP cells transduced with the CAGA‐GFP lentiviral vector and with the pLV‐EV control or ST3GAL5 expression construct were treated with vehicle control or TGF‐β for the indicated times. SMAD3/SMAD4‐dependent (CAGA)12‐mediated transcriptional GFP reporter expression levels were monitored with an IncuCyte system. The GFP object intensity was normalized to the green intensity at 0 h.
Immunoblot analysis of the epithelial marker E‐cadherin and mesenchymal markers, including N‐cadherin, vimentin, and SNAIL, in A549‐VIM‐RFP cells transduced with the pLV‐EV control or ST3GAL5 expression construct and treated with vehicle control or TGF‐β for 48 h. GAPDH: loading control.
Real‐time expression of RFP‐tagged vimentin was monitored with an IncuCyte system in A549‐VIM‐RFP cells transduced with pLV‐EV or the ST3GAL5 expression construct and treated with vehicle control or TGF‐β for the indicated times. The red object intensity was normalized to the red intensity at 0 h.
Alexa Fluor 488 phalloidin staining of F‐actin (green) in pLV‐EV control‐ or ST3GAL5‐expressing A549‐VIM‐RFP cells after stimulation with vehicle control or TGF‐β for 48 h. Nuclei were counterstained with DAPI (blue). Images were acquired with confocal microscopy. Scale bar = 50 μm.
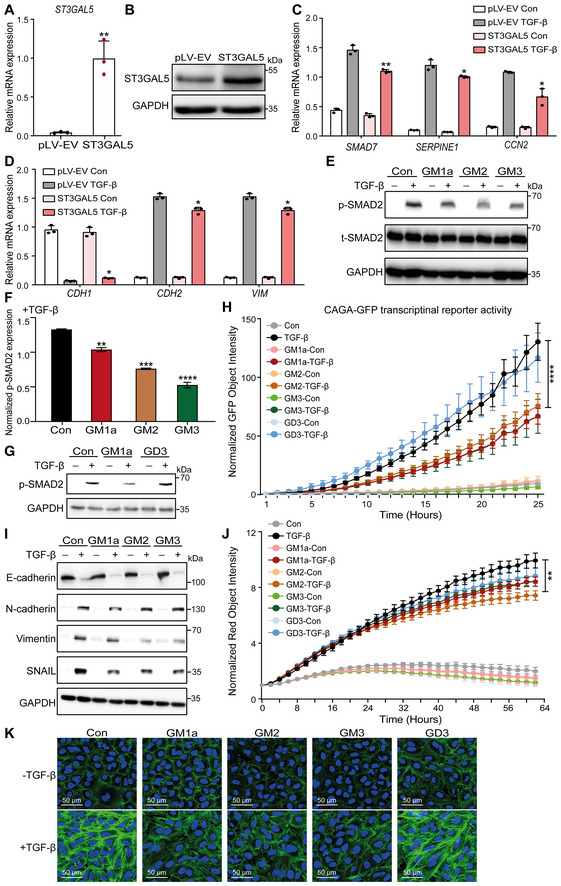
qRT–PCR analysis of ST3GAL5 in A549‐VIM‐RFP cells lentivirally transduced with the pLV‐EV control or ST3GAL5 expression construct.
Immunoblot analysis of ST3GAL5 expression in A549‐VIM‐RFP cells transduced with the pLV‐EV or ST3GAL5 expression construct. GAPDH, loading control.
qRT–PCR analysis of TGF‐β target genes, including SMAD7, SERPINE1 and CCN2, in A549‐VIM‐RFP cells transduced with the pLV‐EV control or ST3GAL5 expression construct and treated with vehicle control or TGF‐β for 6 h.
CDH1, CDH2 and VIM mRNA levels in A549‐VIM‐RFP cells transduced with or without the ST3GAL5 expression construct and treated with vehicle control or TGF‐β for 2 days.
A549‐VIM‐RFP cells were preincubated with 50 μg/ml GM1a, GM2, or GM3 for 24 h and were then treated with vehicle control or TGF‐β for 1 h. Immunoblot analysis of p‐SMAD2 and t‐SMAD2 was then performed. GAPDH: loading control.
Quantification of the p‐SMAD2 level in A549‐VIM‐RFP cells treated with 50 μg/ml GM1a, GM2, or GM3 in combination with TGF‐β (results shown in E).
A549‐VIM‐RFP cells were pretreated with 50 μg/ml GM1a or GD3 for 24 h and were then treated with vehicle control or TGF‐β for 1 h. The levels of p‐SMAD2 were measured by western blotting. GAPDH: loading control.
A549‐VIM‐RFP cells transduced with the CAGA‐GFP lentiviral vector were pretreated with 50 μg/ml GM1a, GM2, GM3 or GD3 for 24 h and were then treated with vehicle control or TGF‐β for the indicated times. SMAD3/SMAD4‐dependent (CAGA)12‐mediated transcriptional GFP reporter expression levels were monitored with an IncuCyte system. The GFP object intensity was normalized to the green intensity at 0 h.
The expression levels of the epithelial marker E‐cadherin and mesenchymal markers, including N‐cadherin, vimentin, and SNAIL, in A549‐VIM‐RFP cells preincubated with 50 μg/ml GM1a, GM2, or GM3 for 24 h and then treated with vehicle control or TGF‐β for another 48 h were measured by immunoblotting. GAPDH: loading control.
A549‐VIM‐RFP cells were pretreated with 50 μg/ml GM1a, GM2, GM3 or GD3 for 24 h and were then incubated with vehicle control or TGF‐β (2.5 ng/ml) for the indicated times. Real‐time expression of RFP‐tagged vimentin was monitored with an IncuCyte system, and the red object intensity was normalized to the red intensity at 0 h.
Alexa Fluor 488 phalloidin staining of F‐actin (green) in A549‐VIM‐RFP cells preincubated with 50 μg/ml GM1a, GM2, GM3 or GD3 for 24 h and then treated with vehicle control or TGF‐β for another 48 h. Nuclei were counterstained with DAPI (blue). Images were acquired with confocal microscopy. Scale bar = 50 μm.
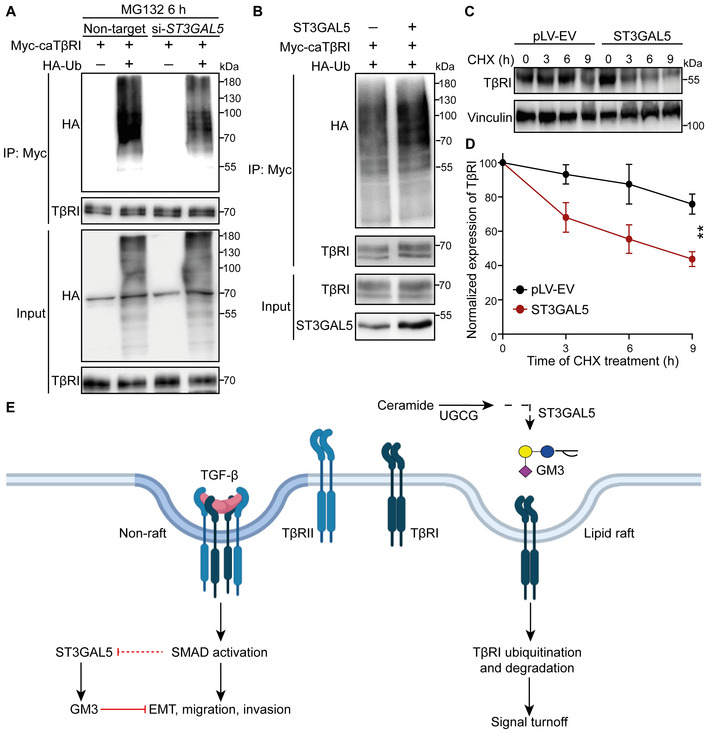
HEK293T cells transfected with Myc‐tagged caTβRI, (HA‐Ub, and nontargeting siRNA or ST3GAL5 siRNA were collected for IP with an anti‐Myc antibody and immunoblot analysis. All groups were treated with MG132 (5 μM) for 6 h.
Ubiquitination of TβRI was detected by IP of Myc‐tagged caTβRI from HA‐Ub‐transfected HEK293T cells with or without ST3GAL5 overexpression. All groups were treated with MG132 (5 μM) for 6 h.
Western blot analysis of TβRI expression in A549‐VIM‐RFP cells transduced with the pLV‐EV control or ST3GAL5 expression construct and treated with CHX for the indicated times. Vinculin: loading control.
Quantification of TβRI expression in pLV‐EV control‐ and ST3GAL5‐expressing A549‐VIM‐RFP cells. The results were normalized to the t = 0 controls. The data are shown as the mean ± SD of three independent experiments. **P < 0.01 based on two‐way ANOVA.
Working model for UGCG–ST3GAL5–GM3‐mediated inhibition of TGF‐β signaling via induction of TβRI localization in lipid rafts. The dashed arrow indicates that the SMAD activation‐induced decrease in ST3GAL5 expression has not been formally shown.
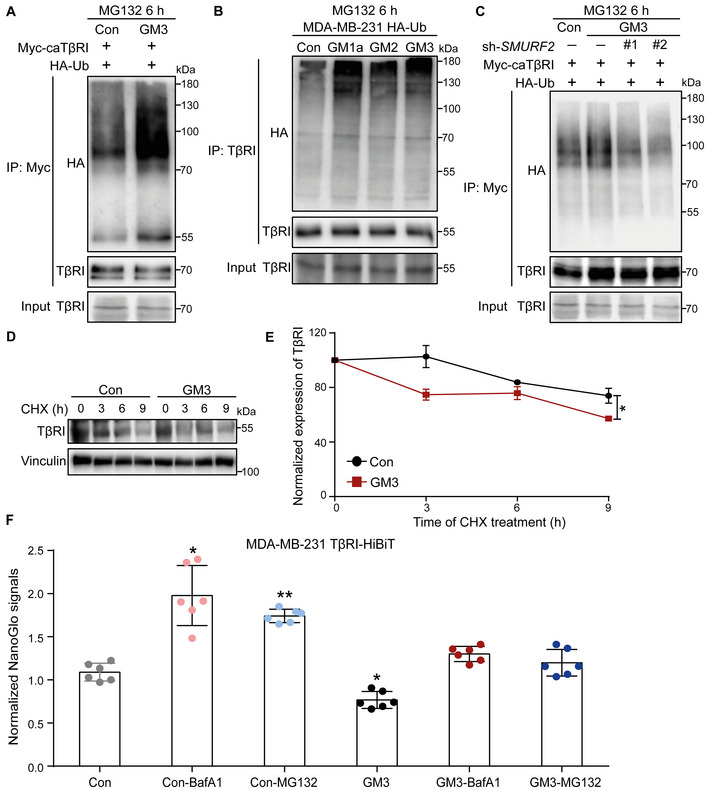
Ubiquitination of TβRI was detected by IP of Myc‐tagged caTβRI from HA‐Ub‐transfected HEK293T cells with or without exogenous addition of GM3 (50 μg/ml) for 24 h. All groups were treated with MG132 (5 μM) for 6 h.
Western blot analysis of whole‐cell lysates (Input) and immunoprecipitates from MDA‐MB‐231 cells stably expressing HA‐Ub with or without exogenous addition of 50 μg/ml GM1a, GM2 or GM3 for 24 h. Total ubiquitination of TβRI was evaluated. All groups were treated with MG132 (5 μM) for 6 h.
HA‐Ub‐expressing HEK293T cells transfected with Myc‐tagged caTβRI and two SMURF2 shRNAs (sh#1 and sh#2) were treated with or without 50 μg/ml GM3 for 24 h. Cells were then harvested for IP with an anti‐Myc antibody followed by IB analysis of HA‐Ub and TβRI. All groups were treated with MG132 (5 μM) for 6 h.
Western blot analysis of TβRI expression in A549‐VIM‐RFP cells with or without exogenous addition of GM3 (50 μg/ml) for 24 h followed by CHX treatment for the indicated times. Vinculin: loading control.
Quantification of TβRI expression in the control and GM3‐treated groups of A549‐VIM‐RFP cells. Expression levels were normalized to the t = 0 controls. The data are shown as the mean ± SD of three independent experiments. *P ≤ 0.05 based on unpaired Student's t‐test.
Measurement of TβRI‐HiBiT as evaluated by the Nano‐Glo signal in MDA‐MB‐231 cells with or without GM3 (50 μg/ml) challenge for 24 h followed by treatment with the proteasome inhibitor MG132 (5 μM) or lysosome inhibitor BafA1 (20 nM) for 6 h. The Nano‐Glo signal intensities were normalized to the GFP intensity in cells and are expressed as the mean ± SD of six biological replicates (n = 6). *P ≤ 0.05; **P < 0.01 based on unpaired Student's t‐test.
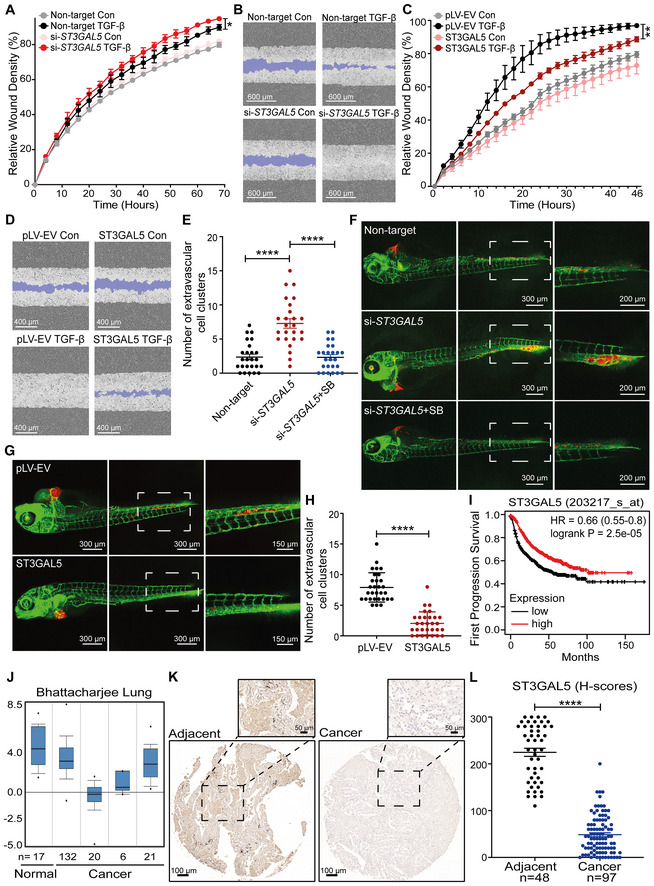
Real‐time scratch assay results were analyzed by an IncuCyte system in ST3GAL5 siRNA‐depleted or nontargeting siRNA‐transfected A549‐VIM‐RFP cells treated with vehicle control or TGF‐β (2.5 ng/ml) for the indicated times. The relative wound density (closure) values are presented as the means ± SD values from three biological replicates (n = 3). *P ≤ 0.05 based on two‐way ANOVA.
Representative images of a scratch wound at the final time point (68 h) in nontargeting siRNA‐transfected and ST3GAL5 siRNA knockdown A549‐VIM‐RFP cells treated with vehicle control or TGF‐β (2.5 ng/ml). The region of the original scratch is indicated in purple. Scale bar = 600 μm.
The time course of wound closure was analyzed by an IncuCyte system in A549‐VIM‐RFP cells transduced with the pLV‐EV control or ST3GAL5 expression construct and treated with vehicle control or TGF‐β (2.5 ng/ml) for the indicated times. The relative wound density (closure) values are presented as the means ± SD values from three biological replicates (n = 3). **P < 0.01 based on two‐way ANOVA.
Representative images of a scratch wound at the 46 h time point in A549‐VIM‐RFP cells transduced with the pLV‐EV control or ST3GAL5 ectopic expression construct. The original scratch region is indicated in purple. Scale bar = 400 μm.
mCherry‐labeled A549 cells with ST3GAL5 siRNA depletion or transfection of nontargeting control siRNA were injected into ducts of Cuvier of zebrafish embryos. Zebrafish embryos in the SB group were treated with the inhibitor SB505124 (1 μM) in the egg water for 4 days after injection with daily refreshment of the treatment. The number of extravasated cell clusters was quantified in 25 embryos per group. ****P < 0.0001 based on unpaired Student's t‐test, n = 2.
Representative images with magnified regions (outlined with dotted squares) of extravasated A549 cells in the indicated groups were acquired 4 days after injection by confocal microscopy. Scale bar = 300 or 200 μm.
In vivo zebrafish extravasation experiments with mCherry‐labeled A549 cells with or without ectopic expression of ST3GAL5. Representative images with magnified regions (outlined with dotted squares) of extravasated cells were acquired 4 days after injection by confocal microscopy. Scale bar = 300 or 150 μm.
The number of extravasated cell clusters was quantified in 30 embryos injected with A549 cells transduced with the pLV‐EV control or ST3GAL5 expression construct. ****P < 0.0001 based on unpaired Student's t‐test, n = 2.
Kaplan–Meier survival curves showing the first progression survival of lung cancer patients in a publicly available lung cancer dataset according to ST3GAL5 expression (n = 982).
Box plots of ST3GAL5 gene expression levels in lung cancer tissues and normal tissues in the Bhattacharjee Lung database. The central bands indicate the medium expression values of ST3GAL5, boxes indicate the expression level ranges of ST3GAL5. Data are presented as the means ± SDs from the indicated number of tissues.
Representative images of ST3GAL5 immunohistochemistry in a human lung tissue microarray including normal and cancer tissues. Wide field and magnified images (outlined with dotted squares) are shown. Scale bar = 100 μm.
Scatter plot showing the expression of ST3GAL5 in normal and cancerous lung tissues. Each point represents the H‐score of a single tissue sample with ST3GAL5 staining ranging from completely absent (H‐score 0) to very strong (H‐score 300). H‐scores are presented as the means ± SDs; normal tissues, n = 48; cancer tissues, n = 97; ****P < 0.0001 based on unpaired Student's t‐test.
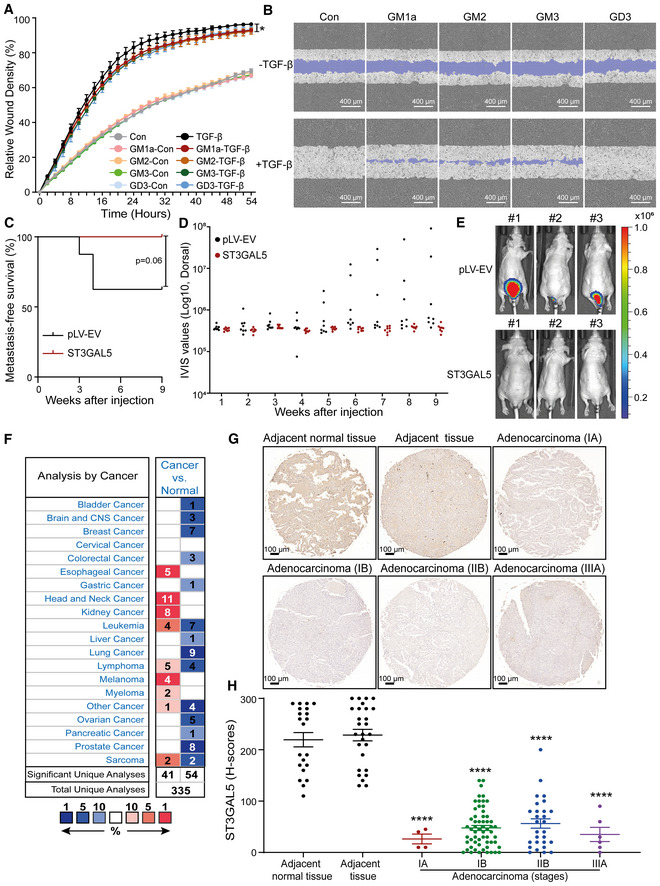
A549‐VIM‐RFP cells were pretreated with 50 μg/ml GM1a, GM2, GM3, or GD3 for 24 h and were then incubated with vehicle control or TGF‐β (2.5 ng/ml) for the indicated times. The time course of wound healing was analyzed by an IncuCyte system. The relative wound density (closure) values are presented as the means ± SD values from three biological replicates (n = 3). *P ≤ 0.05 based on two‐way ANOVA.
Representative images of a scratch wound at the 50 h time point in A549‐VIM‐RFP cells with exogenous addition of 50 μg/ml GM1a, GM2, GM3, or GD3 and treatment with vehicle control or TGF‐β (2.5 ng/ml). The original scratch region is indicated in purple. Scale bar = 400 μm.
Kaplan–Meier analysis of metastasis‐free survival of eight mice injected with A549‐Luc cells transduced with the pLV‐EV control or eight mice in the group with ST3GAL5 expression construct. The log‐rank test was used for statistical analysis; P = 0.06.
Analysis of the IVIS values from eight mice in each indicated group.
Whole‐body images (BLI) at 9 weeks of three mice injected with A549‐Luc cells transduced with the pLV‐EV control or ST3GAL5 expression construct. In Appendix Fig S9D, the BLI of eight mice in each group are shown.
Oncomine database summary of ST3GAL5 gene expression in various cancers. The comparison indicates the number of datasets with statistically significant ST3GAL5 mRNA overexpression (red) and downregulation (blue) in cancer versus normal tissues. The colors indicate the best gene rank percentiles for the within‐data set analyses.
A microarray containing tissues from lung cancer patients was stained with an anti‐ST3GAL5 antibody. Representative images of lung cancer biopsies with adenocarcinoma and adjacent normal tissues are shown. Scale bar = 100 μm.
Scatter plot of ST3GAL5 expression in normal lung tissues and lung cancer tissues of different stages. Each point represents the H‐score from a single tissue sample with ST3GAL5 staining ranging from completely absent (H‐score: 0) to very strong (H‐score: 300). H‐scores are presented as the means ± SDs; adjacent normal tissue, n = 21; cancer‐adjacent lung tissue (adjacent tissue), n = 27; adenocarcinoma (stage IA), n = 4; adenocarcinoma (stage IB), n = 59; adenocarcinoma (stage IIB), n = 28; adenocarcinoma (stage IIIA), n = 6; ****P < 0.0001 based on unpaired Student's t‐test.
References
-
- Anderson RG, Jacobson K (2002) A role for lipid shells in targeting proteins to caveolae, rafts, and other lipid domains. Science 296: 1821–1825 - PubMed
-
- Anugraham M, Everest‐Dass AV, Jacob F, Packer NH (2015) A platform for the structural characterization of glycans enzymatically released from glycosphingolipids extracted from tissue and cells. Rapid Commun Mass Spectrom 29: 545–561 - PubMed
Publication types
MeSH terms
Substances
Associated data
- Actions
LinkOut - more resources
Full Text Sources
Medical
Molecular Biology Databases
