The genetic regulation of protein expression in cerebrospinal fluid
- PMID: 36504281
- PMCID: PMC9832827
- DOI: 10.15252/emmm.202216359
The genetic regulation of protein expression in cerebrospinal fluid
Abstract
Studies of the genetic regulation of cerebrospinal fluid (CSF) proteins may reveal pathways for treatment of neurological diseases. 398 proteins in CSF were measured in 1,591 participants from the BioFINDER study. Protein quantitative trait loci (pQTL) were identified as associations between genetic variants and proteins, with 176 pQTLs for 145 CSF proteins (P < 1.25 × 10⁻¹⁰ , 117 cis-pQTLs and 59 trans-pQTLs). Ventricular volume (measured with brain magnetic resonance imaging) was a confounder for several pQTLs. pQTLs for CSF and plasma proteins were overall correlated, but CSF-specific pQTLs were also observed. Mendelian randomization analyses suggested causal roles for several proteins, for example, ApoE, CD33, and GRN in Alzheimer's disease, MMP-10 in preclinical Alzheimer's disease, SIGLEC9 in amyotrophic lateral sclerosis, and CD38, GPNMB, and ADAM15 in Parkinson's disease. CSF levels of GRN, MMP-10, and GPNMB were altered in Alzheimer's disease, preclinical Alzheimer's disease, and Parkinson's disease, respectively. These findings point to pathways to be explored for novel therapies. The novel finding that ventricular volume confounded pQTLs has implications for design of future studies of the genetic regulation of the CSF proteome.
Keywords: Mendelian randomization; biomarkers; cerebrospinal fluid; genetic regulation; pQTL.
© 2022 The Authors. Published under the terms of the CC BY 4.0 license.
Figures


Relationships between pQTL effect (β) and minor allele frequency (MAF) for CSF pQTLs. cis‐pQTLs and trans‐pQTLs are indicated (only pQTLs significant after Bonferroni correction are included).
For all Bonferroni significant CSF cis‐pQTLs, the degree of significance is shown by the distance from transcription start site (TSS). The interquartile range was −37.3 to 0.12 Kb. The most significant pQTLs are annotated.
Functional annotation of genetic variants for CSF pQTLs, generated by FUMA, for CSF pQTLs that were significant after Bonferroni correction. Enrichment of functional consequences of SNPs was tested against the European 1,000 genome reference panel. Asterixes indicate significant differences between proportions for significant CSF pQTLs versus the reference panel (***P < 0.001; *P < 0.05).


- A–D
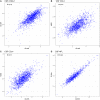
Between‐assay correlations for CSF biomarkers measured with both OLINK methods (proximity extension assay) and orthogonal methods, for four proteins where this data was available (panel A: CHI3L1, panel B: CCL2, panel C: CCL4, panel D: NFL). pQTLs were identified for CHI3L1, CCL2 and CCL4, as described in the main manuscript. pQTLs identified by the orthogonal methods are included in Dataset EV2 (using alternative protein labels for the alternative assays: MCP1 for CCL2, MIP1b for CCL4, and YKL‐40 for CHI3L1, rows marked yellow). For CCL2, the same genetic variant was identified (rs2228467, trans‐pQTL) with both assays. For CCL4, one trans‐pQTLs identified by proximity extension assay was validated (rs113341849) and one cis‐pQTL (rs879571071) was identified, which was in LD with a cis‐pQTL identified for the proximity extension assay (rs8064426, R2 = 0.200, D′ = 0.687). For CHI3L1, one cis‐pQTL was also identified (rs4950928), which was in high LD with a cis‐pQTL identified for the proximity extension assay (rs946262, R2 = 0.902, D′ = 1.0). For all these cases, the effect sizes of the pQTLs were similar, with stable direction of effects.


Number of pQTLs per CSF protein (panel A), and number of CSF proteins per top genetic variant among the identified pQTLs (panel B).


Associations for all CSF proteins with volumes of lateral ventricles. Associations significant after multiple comparisons are indicated in blue. Test assumptions were verified by visual inspection of diagnostic plots. Selected significant proteins are annotated.
Enrichment analysis for CSF proteins associated with ventricles.
Enrichment analysis for CSF proteins not associated with ventricles.

References
-
- Chang D, Nalls MA, Hallgrímsdóttir IB, Hunkapiller J, van der Brug M, Cai F, International Parkinson's Disease Genomics Consortium, 23andMe Research Team , Kerchner GA, Ayalon G et al (2017) A meta‐analysis of genome‐wide association studies identifies 17 new Parkinson's disease risk loci. Nat Genet 49: 1511–1516 - PMC - PubMed
-
- Christiansson L, Mustjoki S, Simonsson B, Olsson‐Strömberg U, Loskog ASI, Mangsbo SM (2014) The use of multiplex platforms for absolute and relative protein quantification of clinical material. EuPA Open Proteom 3: 37–47
Publication types
MeSH terms
Substances
Grants and funding
- U01 AG046152/AG/NIA NIH HHS/United States
- R01 MH109897/MH/NIMH NIH HHS/United States
- R37 MH057881/MH/NIMH NIH HHS/United States
- P50 AG016574/AG/NIA NIH HHS/United States
- U01 MH103392/MH/NIMH NIH HHS/United States
- P30 AG010161/AG/NIA NIH HHS/United States
- R01 AG032990/AG/NIA NIH HHS/United States
- HHSN271201300031C/DA/NIDA NIH HHS/United States
- P50 MH066392/MH/NIMH NIH HHS/United States
- R01 AG018023/AG/NIA NIH HHS/United States
- R01 AG017917/AG/NIA NIH HHS/United States
- 681712/ERC_/European Research Council/International
- R01 AG068398/AG/NIA NIH HHS/United States
- R01 MH109677/MH/NIMH NIH HHS/United States
- R01 NS080820/NS/NINDS NIH HHS/United States
- P50 MH084053/MH/NIMH NIH HHS/United States
- R01 MH097276/MH/NIMH NIH HHS/United States
- P01 AG002219/AG/NIA NIH HHS/United States
- R01 MH093725/MH/NIMH NIH HHS/United States
- P50 AG005138/AG/NIA NIH HHS/United States
- U01 AG046139/AG/NIA NIH HHS/United States
- P01 AG003949/AG/NIA NIH HHS/United States
- U24 NS072026/NS/NINDS NIH HHS/United States
- P30 AG019610/AG/NIA NIH HHS/United States
- R01 AG048015/AG/NIA NIH HHS/United States
- P50 AG025711/AG/NIA NIH HHS/United States
- R01 MH110921/MH/NIMH NIH HHS/United States
- P01 AG017216/AG/NIA NIH HHS/United States
- R01 MH080405/MH/NIMH NIH HHS/United States
- U01 AG006786/AG/NIA NIH HHS/United States
- R01 AG036836/AG/NIA NIH HHS/United States
- R01 MH085542/MH/NIMH NIH HHS/United States
- R01 AG015819/AG/NIA NIH HHS/United States
LinkOut - more resources
Full Text Sources
Medical
Research Materials
Miscellaneous

