. 2022 Dec;10(6):e01035.
doi: 10.1002/prp2.1035.

Dose-dependent effects of esketamine on brain activity in awake mice: A BOLD phMRI study

Affiliations

Dose-dependent effects of esketamine on brain activity in awake mice: A BOLD phMRI study

Kyrsten Kawazoe et al. Pharmacol Res Perspect. 2022 Dec.

Abstract

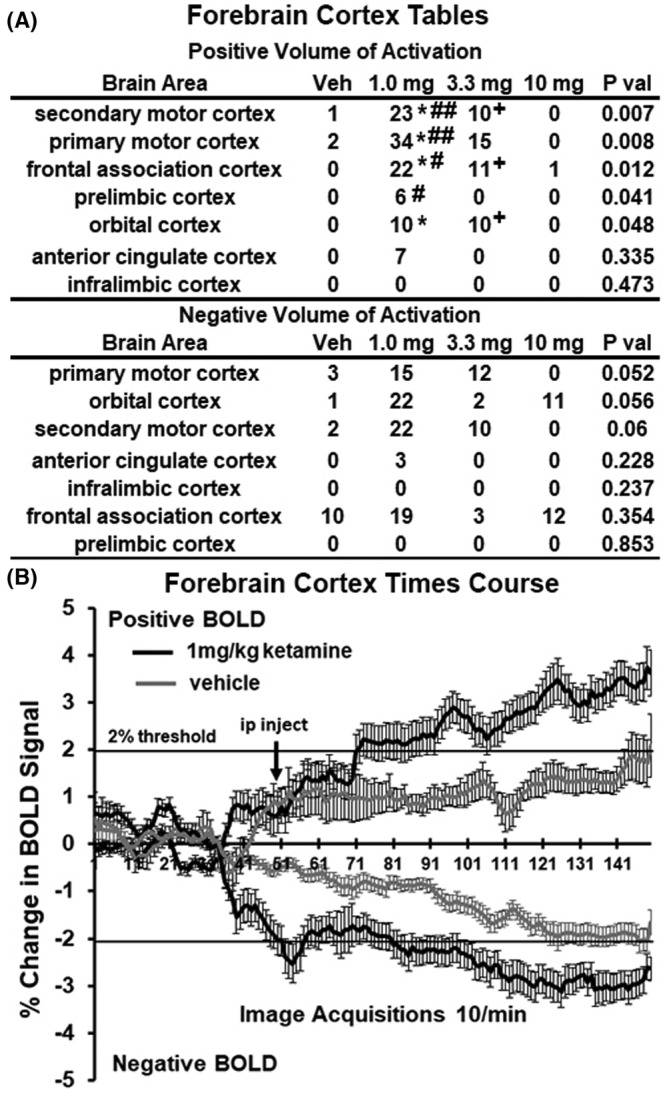
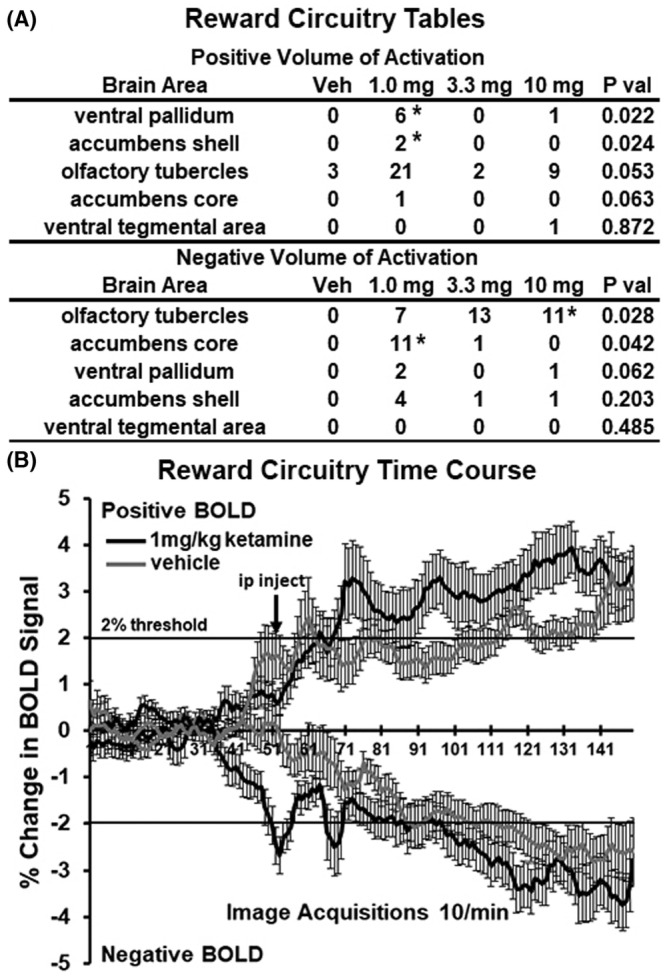
Pharmacological magnetic resonance imaging (phMRI) is a noninvasive method used to evaluate neural circuitry involved in the behavioral effects of drugs like ketamine, independent of their specific biochemical mechanism. The study was designed to evaluate the immediate effect of esketamine, the S-isomer of (±) ketamine on brain activity in awake mice using blood oxygenation level dependent (BOLD) imaging. It was hypothesized the prefrontal cortex, hippocampus, and brain areas associated with reward and motivation would show a dose-dependent increase in brain activity. Mice were given vehicle, 1.0, 3.3, or 10 mg/kg esketamine I.P. and imaged for 10 min post-treatment. Data for each treatment were registered to a 3D MRI mouse brain atlas providing site-specific information on 134 different brain areas. There was a global change in brain activity for both positive and negative BOLD signal affecting over 50 brain areas. Many areas showed a dose-dependent decrease in positive BOLD signal, for example, cortex, hippocampus, and thalamus. The most common profile when comparing the three doses was a U-shape with the 3.3 dose having the lowest change in signal. At 1.0 mg/kg there was a significant increase in positive BOLD in forebrain areas and hippocampus. The anticipated dose-dependent increase in BOLD was not realized; instead, the lowest dose of 1.0 mg/kg had the greatest effect on brain activity. The prefrontal cortex and hippocampus were significantly activated corroborating previous imaging studies in humans and animals. The unexpected sensitivity to the 1.0 mg/kg dose of esketamine could be explained by imaging in fully awake mice without the confound of anesthesia and/or its greater affinity for the N-methyl-d-aspartate receptor (NMDAR) receptor than (±) ketamine.

Keywords: NMDA; depression; hippocampus; phMRI; prefrontal cortex.


Figures

FIGURE 1
FIGURE 1
Motion artifact. Shown is the degree of motion artifact recorded over the 15 min imaging protocol. The data are reported as the mean and standard deviation in micrometers for axis Y, Z, and X for the eight mice injected with the 10 mg dose of esketamine. The largest movement in the X axis (left to right head motion) was ca 40 μm for any mouse.
FIGURE 2
FIGURE 2
Neuroanatomical fidelity. Shown are representative examples of brain images collected during a single imaging session using a multi‐slice spin echo, RARE (rapid acquisition with relaxation enhancement) pulse sequence. The row on the top shows axial sections collected during the anatomical scan taken at the beginning of each imaging session using a data matrix of 256 × 256, 18 slices in a field of view of 3.0 cm. The row below shows the same images but collected for functional analysis using HASTE, a RARE pulse sequence modified for faster acquisition time. These images were acquired using the same field of view and slice anatomy but a larger data matrix of 96 × 96. Note the anatomical fidelity between the functional images and their original anatomical image. The absence of any distortion is necessary when registering the data to the atlas to resolve 134 segmented brain areas.
FIGURE 3
FIGURE 3
BOLD signal changes in the hippocampus. The tables (A) show the positive and negative changes in BOLD volume of activation (voxel numbers) for each of the doses of esketamine in the hippocampus. Positive volume of activation: (*p < 0.05, 1.0 mg vs Veh); (#p < 0.05, 1.0 mg CA3 vs 10 mg CA3); (+p < 0.05, 3.3 mg CA1 vs 10 mg CA1); (++p < 0.01, 3.3 mg subiculum vs 10 mg subiculum). Negative volume of activation: (*p < 0.05, 1.0 mg vs Veh, 3.3 mg CA1 vs Veh); (**p < 0.01, 3.3 mg CA3 vs Veh). The time series below (B) show positive and negative changes in BOLD signal over the 15 min imaging period comparing the 1.0 mg dose of esketamine to vehicle. For positive change in signal, esketamine was greater than vehicle (F (1,58) = 27.40, p < 0.0001;). For negative change in signal, esketamine was greater than vehicle (F (1,58) = 23.39, p < 0.0001).
FIGURE 4
FIGURE 4
Localization of negative and positive BOLD voxels. The 2D maps show the localization of positive and negative BOLD voxels collected during the scanning session registered to the segmented MRI mouse atlas. These composites represent the average number of voxels from the eight mice injected with 1.0 mg/kg of esketamine. Sections are aligned rostral (top) to caudal (bottom).
FIGURE 5
FIGURE 5
BOLD signal changes in the forebrain. The tables (A) show the positive and negative changes in BOLD volume of activation (voxel numbers) for each of the doses of esketamine in areas of the forebrain. Denoted areas are significantly different from vehicle or from each other. (*p < 0.05, 1.0 mg vs vehicle); (#p < 0.05 and ##p < 0.01, 1.0 mg vs 10 mg); (+p < 0.05, 3.3 mg vs 10 mg). The time series below (B) show positive and negative changes in BOLD signal over the 15 min imaging period comparing the 1.0 mg dose of esketamine to vehicle. For positive change in signal, esketamine was greater than vehicle (F (1,103) = 8.074, p < 0.0054). For negative change in signal, esketamine was greater than vehicle (F (1,103) = 17.58, p < 0.0001).
FIGURE 6
FIGURE 6
Bold signal changes in reward areas. The tables (A) show the positive and negative changes in BOLD volume of activation (voxel numbers) for each of the doses of esketamine in the areas of reward circuitry. Denoted areas are significantly different from vehicle. (*p < 0.05, 1.0 mg vs Veh, 10 mg vs Veh). There was no significant difference in positive or negative BOLD signal over time (B) between vehicle and esketamine (2‐way ANOVA, F (1,73) = 1.431, p = .2355; F (1,73) = 3.321, p = .0725, respectively).

Similar articles

Cited by

References

    1. Hasin DS, Sarvet AL, Meyers JL, et al. Epidemiology of adult DSM‐5 major depressive disorder and its specifiers in the United States. JAMA Psychiat. 2018;75:336‐346. - PMC - PubMed
    1. Chow W, Doane MJ, Sheehan JP, Alphs L, Le H. Economic burden among patients with major depressive disorder: an analysis of healthcare resource use, work productivity, and direct and indirect costs by depression severity. Am J Manag Care. 2019;23:262‐270.
    1. Malhi GS, Bell E, Singh AB, et al. The 2020 Royal Australian and New Zealand College of Psychiatrists clinical practice guidelines for mood disorders: major depression summary. Bipolar Disord. 2020;22:788‐804. - PubMed
    1. de Sousa RT, Zanetti MV, Brunoni AR, Machado‐Vieira R. Challenging treatment‐resistant major depressive disorder: a roadmap for improved therapeutics. Curr Neuropharmacol. 2015;13:616‐635. - PMC - PubMed
    1. Bahji A, Vazquez GH, Zarate CA Jr. Comparative efficacy of racemic ketamine and esketamine for depression: a systematic review and meta‐analysis. J Affect Disord. 2021;278:542‐555. - PMC - PubMed

LinkOut - more resources