. 2022 Dec 1:2022:6795573.
doi: 10.1155/2022/6795573. eCollection 2022.

Asymptomatic Hyperuricemia Is Associated with Achilles Tendon Rupture through Disrupting the Normal Functions of Tendon Stem/Progenitor Cells

Affiliations

Asymptomatic Hyperuricemia Is Associated with Achilles Tendon Rupture through Disrupting the Normal Functions of Tendon Stem/Progenitor Cells

Jingjing Liang et al. Stem Cells Int. .

Abstract

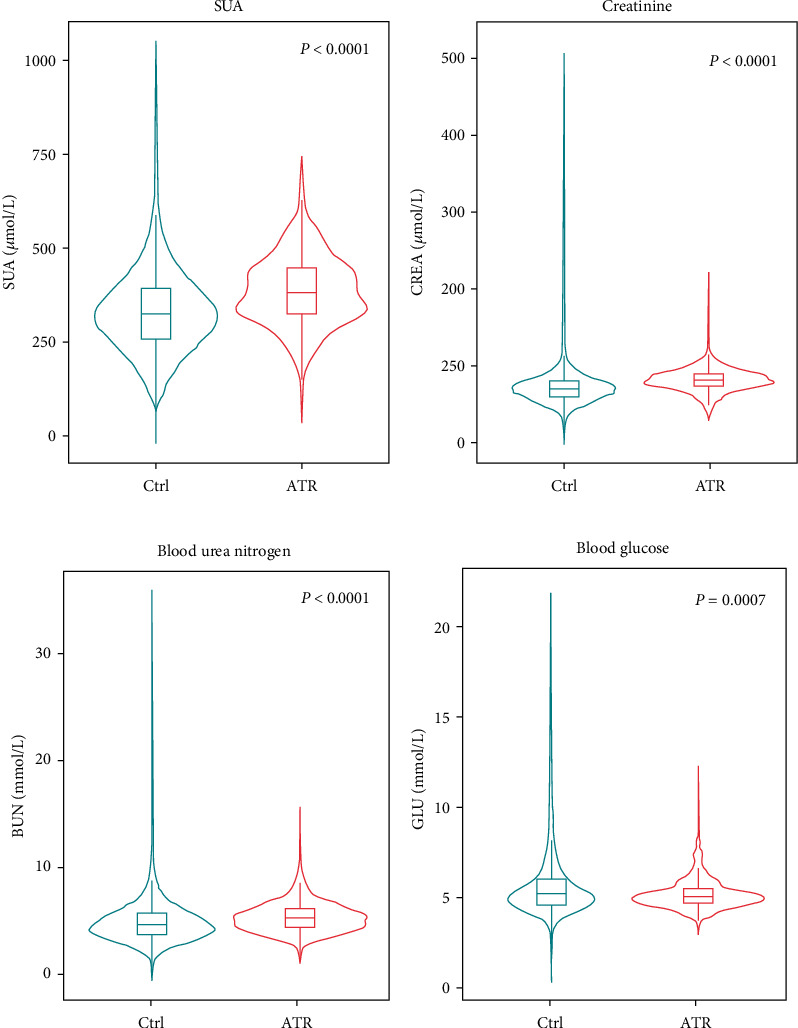
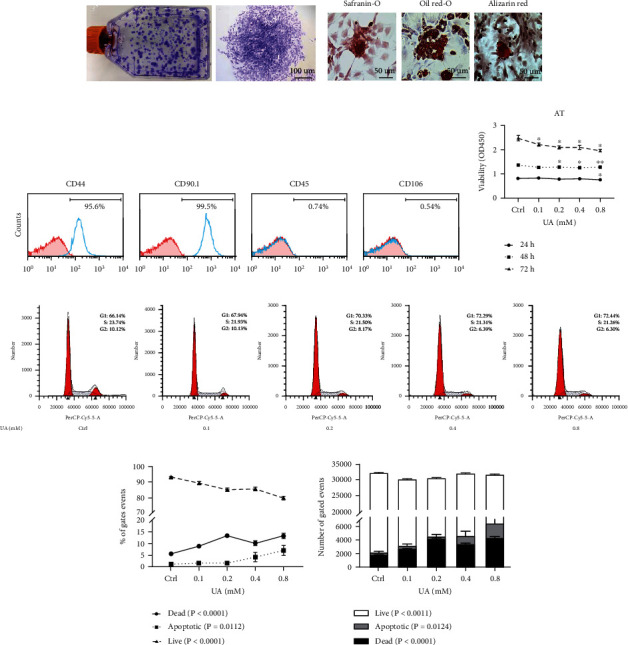
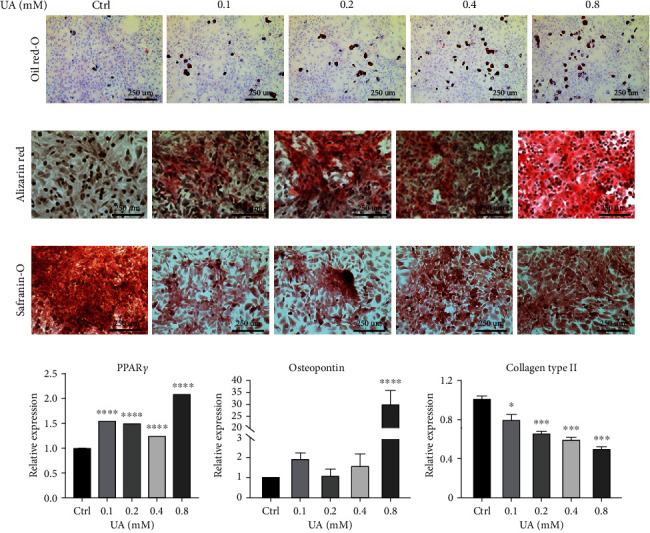
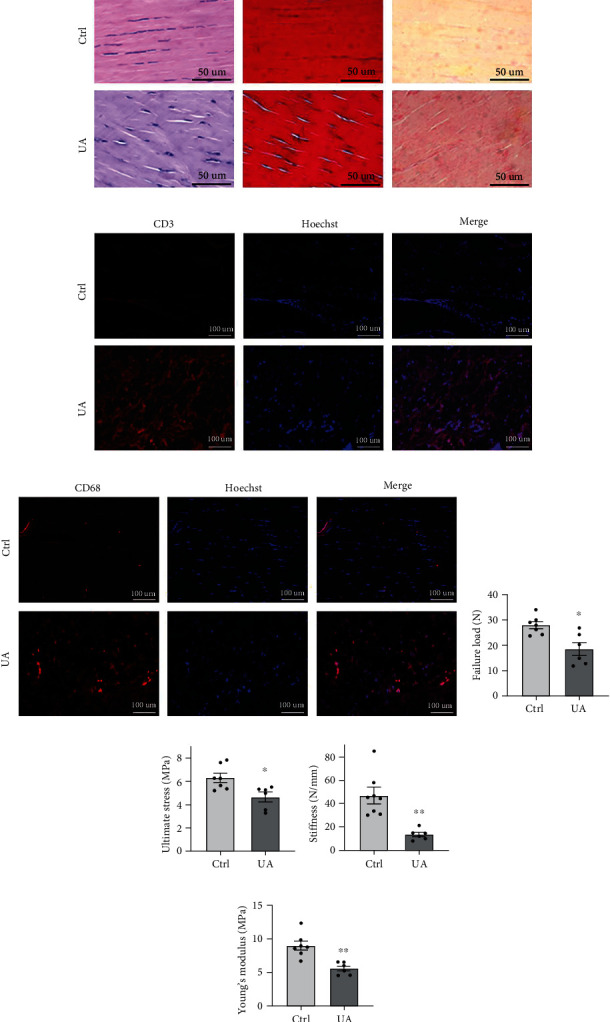
Hyperuricemia is a metabolic disorder that is essential to the development of inflammatory gout, with increasing prevalence over recent years. Emerging clinical findings has evidenced remarkable tendon damage in individuals with longstanding asymptomatic hyperuricemia, yet the impact of hyperuricemia on tendon homeostasis and associated repercussions is largely unknown. Here, we investigated whether asymptomatic hyperuricemia was associated with spontaneous ruptures in the Achilles tendon and the pathological effect of hyperuricemia on the tendon stem/progenitor cells (TSPCs). Significantly higher serum uric acid (SUA) levels were found in 648 closed Achilles tendon rupture (ATR) patients comparing to those in 12559 healthy volunteers. In vitro study demonstrated that uric acid (UA) dose dependently reduced rat Achilles TSPC viability, decreased the expressions of tendon collagens, and deformed their structural organization while significantly increased the transcript levels of matrix degradative enzymes and proinflammatory factors. Consistently, marked disruptions in Achilles tendon tissue structural and functional integrity were found in a rat model of hyperuricemia, together with enhanced immune cell infiltration. Transcriptome analysis revealed a significant elevation in genes involved in metabolic stress and tissue degeneration in TSPCs challenged by hyperuricemia. Specifically, reduced activity of the AKT-mTOR pathway with enhanced autophagic signaling was confirmed. Our findings indicate that asymptomatic hyperuricemia may be a predisposition of ATR by impeding the normal functions of TSPCs. This information may provide theoretical and experimental basis for exploring the early prevention and care of ATR.


Conflict of interest statement

The authors declare that there is no conflict of interest.

Figures

Figure 1
Figure 1
Comparison analyses between the ATR group and the control subjects. The levels of SUA (P < 0.0001) (a), creatinine (P < 0.0001) (b), blood urea nitrogen (P < 0.0001) (c), and blood glucose (P = 0.0007) (d) exhibited significant differences in ATR patients (n = 648) and the control group of volunteers (n = 12559).
Figure 2
Figure 2
Effects of UA treatment on TSPC viability and survival. Characteristics of primary cells extracted from SD rat tendon were determined in (a)–(c). (a) Primary cell colonies stained with crystal violet at 12 days. (b) Primary cells cultured under differentiation conditions for 21 days, followed by safranin O, oil red O, and alizarin red S staining to detect chondrogenic, adipogenic, and osteogenic differentiation, respectively. (c) Flow cytometry analysis of the expression of cell surface markers related to stem cells (CD44 and CD90.1), leukocyte (CD45), and endothelial cell (CD106). (d) CCK8 assays were used to assess TSPC proliferation over a course of 72 h, with the addition of PBS or UA (0.1, 0.2, 0.4, and 0.8 mM). (e) Representative images show cell cycle distribution with flow cytometric analysis with UA treatment after 48 h. Changes in the percentile (f) and numbers (g) of live, apoptotic and dead TSPCs were assessed over 48 h with UA treatment. A control treated with PBS was included in all experiments. Results are presented as the mean ± SEM from three independent experiments, using TSPC isolates from 3 individual rats. Data were analyzed using ANOVA. P < 0.05; ∗∗P < 0.01 versus PBS-treated control at the relevant time point.
Figure 3
Figure 3
Effects of UA on the nontenocytic differentiation of TSPCs. TSPCs were subjected to three types of differentiation media with the addition of PBS or various concentrations of UA for 21 days. (a–c) Subsequent to the differentiation course, oil red O staining (a), alizarin red staining (b), and safranin O staining (c) were performed to assess changes in adipogenesis, osteogenesis, and chondrogenesis of rat TSPCs, respectively. Representative images of each group show morphological alterations and visible changes in staining intensity (n = 3 each). Bars = 250 μm. (d–f) Real-time qPCR analysis was applied to determine expression of marker genes in TSPC postcomplete differentiation. PPARγ was used as the marker of adipogenic differentiation (d), with osteopontin for osteogenic (e), and collagen type 2 for chondrogenic differentiation (f). Values are the mean ± SEM from three independent experiments. Data were analyzed using two-way ANOVA. P < 0.05; ∗∗∗P < 0.001; ∗∗∗∗P < 0.0001 versus PBS-treated control within each group.
Figure 4
Figure 4
Characterization of the AT tissue from the experimental rat model of hyperuricemia. (a–c) Representative sections of AT from rats intragastrically administered with 0.5% sodium carboxymethylcellulose (n = 5) or UA (n = 6). Tendon tissues showed remarkable differences in the morphology by hematoxylin and eosin staining ((a), left) and in the collagen expression by Masson's trichrome (MT) staining ((a), middle) and Sirius red staining ((a), right). Bars = 50 μm. (b, c) Representative sections were stained for CD3 (b) and CD68 (c) in red, and nuclei were stained with Hoechst 33258 (blue). Bars = 100 μm. (d–g) Comparison of mechanical testing results of the rat AT tissue postinduction of UA (n = 6) or the vehicle control (n = 7) in the failure load (d), the ultimate stress level (e), the stiffness (f), and the levels of Young's modulus (g). Values are the mean ± SEM of average data from 2 independent experiments. P < 0.05; ∗∗P < 0.01 versus vehicle alone.
Figure 5
Figure 5
Analysis of the transcriptome and protein expressions in TSPCs treated with different concentrations of UA. (a) Heat map visualization of DEG between TSPCs exposed to UA at the physiological level (0.2 mM) and the level corresponding to hyperuricemia (0.8 mM) for 48 h. (b) GO enrichment of gene sets from TSPCs impacted by hyperuricemia. (c) Cell lysates of TSPCs treated with PBS or various doses of UA for 48 h were tested for the AKT-mTOR pathway, the autophagy markers, and c-Jun activation by Western blot analysis. Results are representative of at least 3 independent experiments.

Similar articles

Cited by

References

    1. Dehlin M., Jacobsson L., Roddy E. Global epidemiology of gout: prevalence, incidence, treatment patterns and risk factors. Nature Reviews Rheumatology . 2020;16(7):380–390. doi: 10.1038/s41584-020-0441-1. - DOI - PubMed
    1. Chen-Xu M., Yokose C., Rai S. K., Pillinger M. H., Choi H. K. Contemporary prevalence of gout and hyperuricemia in the United States and decadal trends: the National Health and Nutrition Examination Survey, 2007–2016. Arthritis & Rhematology . 2019;71(6):991–999. doi: 10.1002/art.40807. - DOI - PMC - PubMed
    1. Zhang M., Zhu X., Wu J., et al. Prevalence of hyperuricemia among Chinese adults: findings from two nationally representative cross-sectional surveys in 2015–16 and 2018–19. Frontiers in Immunology . 2022;12, article 791983 doi: 10.3389/fimmu.2021.791983. - DOI - PMC - PubMed
    1. Feig D. I., Kang D.-H., Johnson R. J. Uric acid and cardiovascular risk. The New England Journal of Medicine . 2008;359(17):1811–1821. doi: 10.1056/NEJMra0800885. - DOI - PMC - PubMed
    1. Zhu Y., Pandya B. J., Choi H. K. Prevalence of gout and hyperuricemia in the US general population: the National Health and Nutrition Examination Survey 2007–2008. Arthritis and Rheumatism . 2011;63(10):3136–3141. doi: 10.1002/art.30520. - DOI - PubMed

LinkOut - more resources