. 2022 Nov 24:13:951401.
doi: 10.3389/fneur.2022.951401. eCollection 2022.

Machine learning approach for hemorrhagic transformation prediction: Capturing predictors' interaction

Affiliations

Machine learning approach for hemorrhagic transformation prediction: Capturing predictors' interaction

Ahmed F Elsaid et al. Front Neurol. .

Abstract

Background and purpose: Patients with ischemic stroke frequently develop hemorrhagic transformation (HT), which could potentially worsen the prognosis. The objectives of the current study were to determine the incidence and predictors of HT, to evaluate predictor interaction, and to identify the optimal predicting models.

Methods: A prospective study included 360 patients with ischemic stroke, of whom 354 successfully continued the study. Patients were subjected to thorough general and neurological examination and T2 diffusion-weighted MRI, at admission and 1 week later to determine the incidence of HT. HT predictors were selected by a filter-based minimum redundancy maximum relevance (mRMR) algorithm independent of model performance. Several machine learning algorithms including multivariable logistic regression classifier (LRC), support vector classifier (SVC), random forest classifier (RFC), gradient boosting classifier (GBC), and multilayer perceptron classifier (MLPC) were optimized for HT prediction in a randomly selected half of the sample (training set) and tested in the other half of the sample (testing set). The model predictive performance was evaluated using receiver operator characteristic (ROC) and visualized by observing case distribution relative to the models' predicted three-dimensional (3D) hypothesis spaces within the testing dataset true feature space. The interaction between predictors was investigated using generalized additive modeling (GAM).

Results: The incidence of HT in patients with ischemic stroke was 19.8%. Infarction size, cerebral microbleeds (CMB), and the National Institute of Health stroke scale (NIHSS) were identified as the best HT predictors. RFC (AUC: 0.91, 95% CI: 0.85-0.95) and GBC (AUC: 0.91, 95% CI: 0.86-0.95) demonstrated significantly superior performance compared to LRC (AUC: 0.85, 95% CI: 0.79-0.91) and MLPC (AUC: 0.85, 95% CI: 0.78-0.92). SVC (AUC: 0.90, 95% CI: 0.85-0.94) outperformed LRC and MLPC but did not reach statistical significance. LRC and MLPC did not show significant differences. The best models' 3D hypothesis spaces demonstrated non-linear decision boundaries suggesting an interaction between predictor variables. GAM analysis demonstrated a linear and non-linear significant interaction between NIHSS and CMB and between NIHSS and infarction size, respectively.

Conclusion: Cerebral microbleeds, NIHSS, and infarction size were identified as HT predictors. The best predicting models were RFC and GBC capable of capturing nonlinear interaction between predictors. Predictor interaction suggests a dynamic, rather than, fixed cutoff risk value for any of these predictors.

Keywords: NIHSS; cerebral microbleeds; hemorrhagic transformation; infarction size; ischemic stroke; machine learning.


Conflict of interest statement

The authors declare that the research was conducted in the absence of any commercial or financial relationships that could be construed as a potential conflict of interest.

Figures

Figure 1
Figure 1
Score matrix of all studied variables assessed by the mRMRe (minimum redundancy maximum relevance) algorithm provided by the varrank R package. The first column represents the relevance scores of different variables assessed by the mutual information algorithm relative to the HT incidence and ranked in a descending manner. Subsequent columns represent the difference between the relevance and redundancy scores of each variable after adding it to the previously selected variable. Positive scores indicate higher relevance than redundancy scores and were color-coded by a scale from yellow to red, whereas negative scores indicate higher redundancy than relevance scores and were color-coded by a scale from aqua to deep blue. Zero scores were colored green.
Figure 2
Figure 2
Comparison of the utilized machine learning models' overall performance using the AUC ± 95% CI metric. Youden indices were estimated using the maximum sensitivity plus specificity. The RFC and GBC models demonstrated significantly larger AUC compared to LRC and MLPC but with no statistical difference between each other and SVC. AUC, area under curve; CI, confidence interval; SVC, support vector classifier; GBC, gradient boosting classifier; LRC, logistic regression classifier; RFC, random forest classifier; MLPC, multilayer perceptron classifier.
Figure 3
Figure 3
3D figure shows the predicted spaces of each ML model within the true feature space. The green area represents the positive HT prediction, while the non-colored area represents the negative prediction. The blue and red dots represent the observed positive and negative HT cases, respectively (the points inside the green predicted space are not visible). The blue dots within the green and clear areas represent true positive and false negative predictions, respectively. The red dots within the green and clear areas represent false positive and true negative predictions, respectively. The best performing models, RFC, GBC, and SVC reveal non-linear decision boundaries indicative of the interaction between the three predictors. At a particular value of NIHSS, observe the reduction of infarction size needed for HT prediction to be green (positive) as the number of CMB increases. Similarly, at a particular value of CMB, observe the reduction of infarction size needed for HT prediction to be green as the NIHSS score increases. LRC did not capture the non-linear relationships and as such, it failed to model the interaction between predictors. The MLPC was not considered for 3D model presentation because of its very low sensitivity. SVC, support vector classifier; GBC, gradient boosting classifier; LRC, logistic regression classifier; RFC, random forest classifier; MLPC, multilayer perceptron classifier.
Figure 4
Figure 4
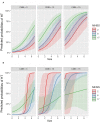
Partial probability of HT incidence as a function of infarction size and conditioned on NIHSS score and CMB count. (A,B) show logistic regression fitted with single terms and a generalized additive model fitted with thin plate regression splines with tensor product terms, respectively. Tensor product terms could delineate the interaction component from the main effect. (A) shows monotonous NIHSS curves that demonstrate similar parametric functions with infarction size at different CMB levels except for an absolute effect representing different intercepts. This logistic regression pattern suggests a failure to detect predictor interaction and hence predictive power. In contrast, (B) demonstrates non-linear HT predicting functions as reflected by NIHSS curves across different levels of CMB and infarction size. For example, at a CMB level of 3, patients with a low NIHSS score of 2 started to respond at an infarction size of around 3.5 and exhibited sharp dependency on infarction size in contrast to patients with an NIHSS of 17, which started to respond at an infarction size of zero but with less dependency on infarction size. At CMB 15, the curve of the NIHSS score of 2 almost reached saturation, whereas the curve of the NIHSS score of 17 almost becomes linear with a low slope demonstrating less dependency on infarction size.

References

    1. Lindley RI, Wardlaw JM, Sandercock PA, Rimdusid P, Lewis SC, Signorini DF, et al. . Frequency and risk factors for spontaneous hemorrhagic transformation of cerebral infarction. J Stroke Cerebrovasc Dis. (2004) 13:235–46. 10.1016/j.jstrokecerebrovasdis.2004.03.003 - DOI - PubMed
    1. Jaillard A, Cornu C, Durieux A, Moulin T, Boutitie F, Lees KR, Hommel M. Hemorrhagic transformation in acute ischemic stroke. The MAST-E study. MAST-E Group. Stroke. (1999) 30:1326–32. 10.1161/01.STR.30.7.1326 - DOI - PubMed
    1. Lei C, Wu B, Liu M, Chen Y. Asymptomatic hemorrhagic transformation after acute ischemic stroke: is it clinically innocuous? J Stroke Cerebrovasc Dis. (2014) 23:2767–72. 10.1016/j.jstrokecerebrovasdis.2014.06.024 - DOI - PubMed
    1. Andrade JBC, Mohr JP, Lima FO, de Carvalho JJF, Barros LCM, Nepomuceno CR, Ferrer JVCC, Silva GS. The role of hemorrhagic transformation in acute ischemic stroke upon clinical complications and outcomes. J Stroke Cerebrovasc Dis. (2020) 29:104898. 10.1016/j.jstrokecerebrovasdis.2020.104898 - DOI - PubMed
    1. Lengerich B, Tan S, Chang CH, Hooker G, Caruana R. Purifying interaction effects with the functional anova: An efficient algorithm for recovering identifiable additive models. In: International Conference on Artificial Intelligence and Statistics. PMLR: (2020). p. 2402–12.

LinkOut - more resources