. 2022;15(12):1041-1047.
doi: 10.1038/s41561-022-01081-3. Epub 2022 Nov 28.

Limited carbon cycling due to high-pressure effects on the deep-sea microbiome

Affiliations

Limited carbon cycling due to high-pressure effects on the deep-sea microbiome

Chie Amano et al. Nat Geosci. 2022.

Abstract

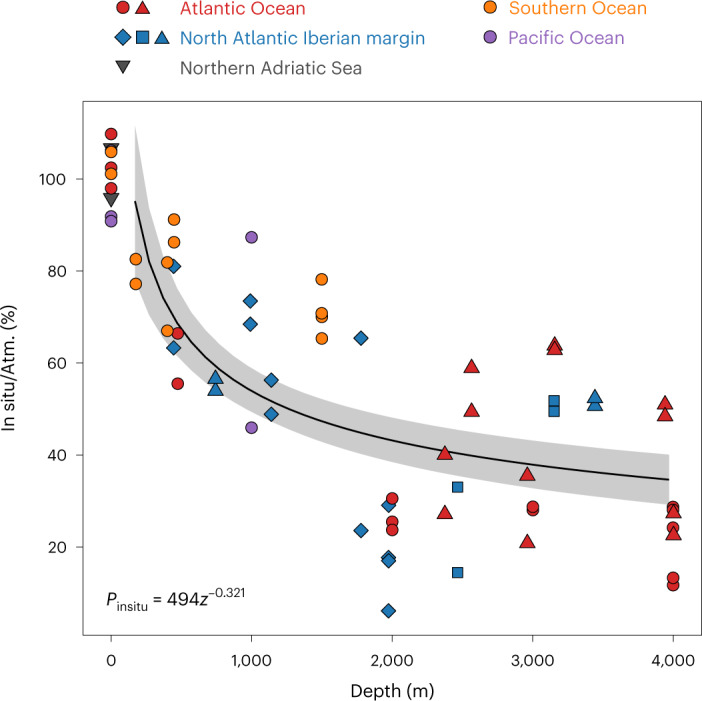
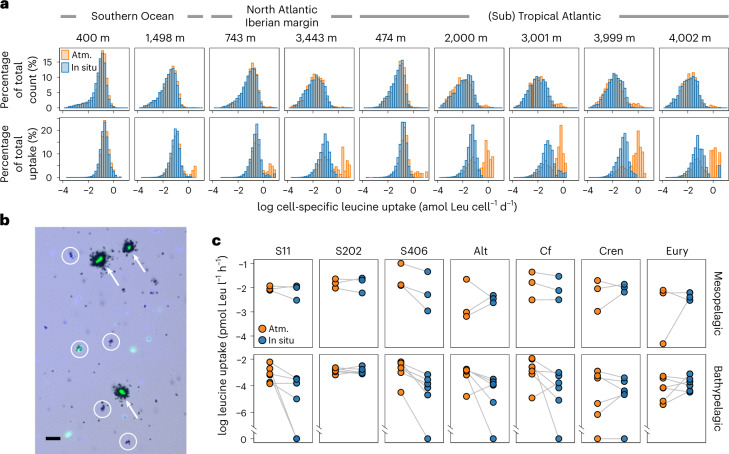
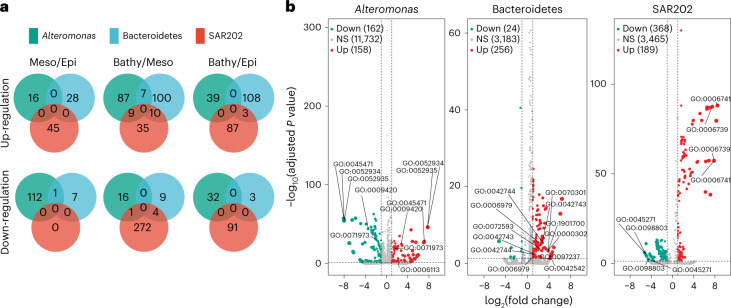
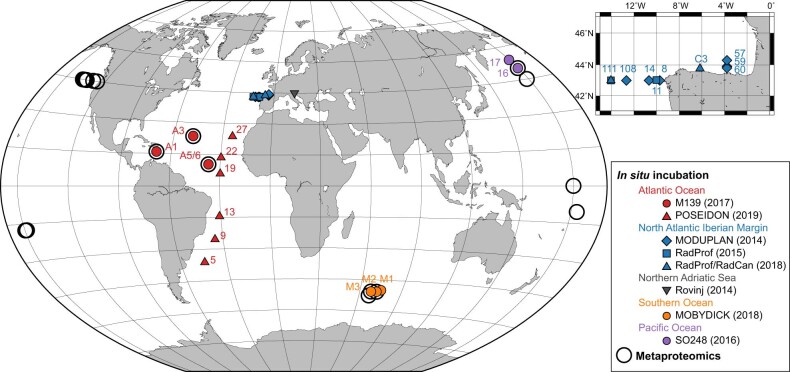
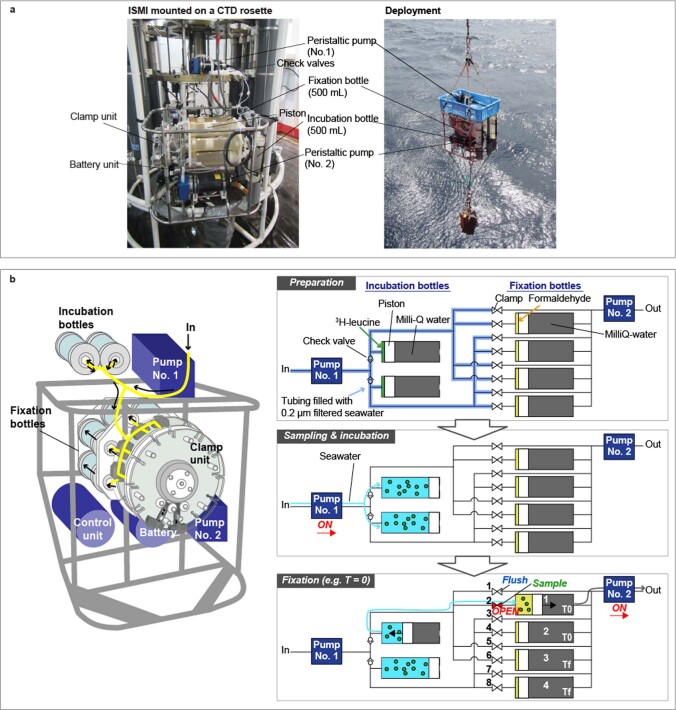
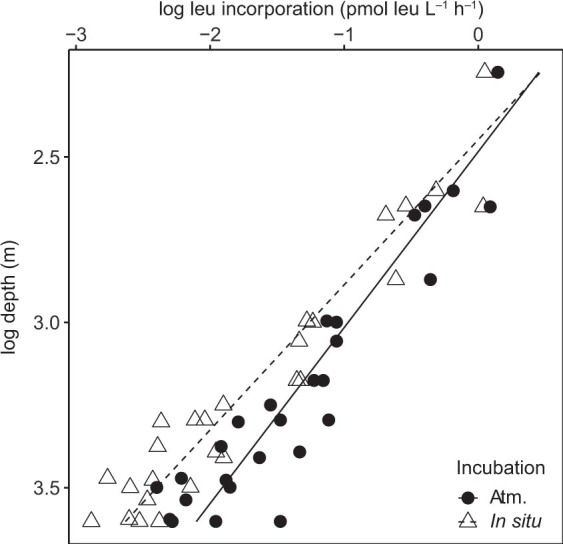
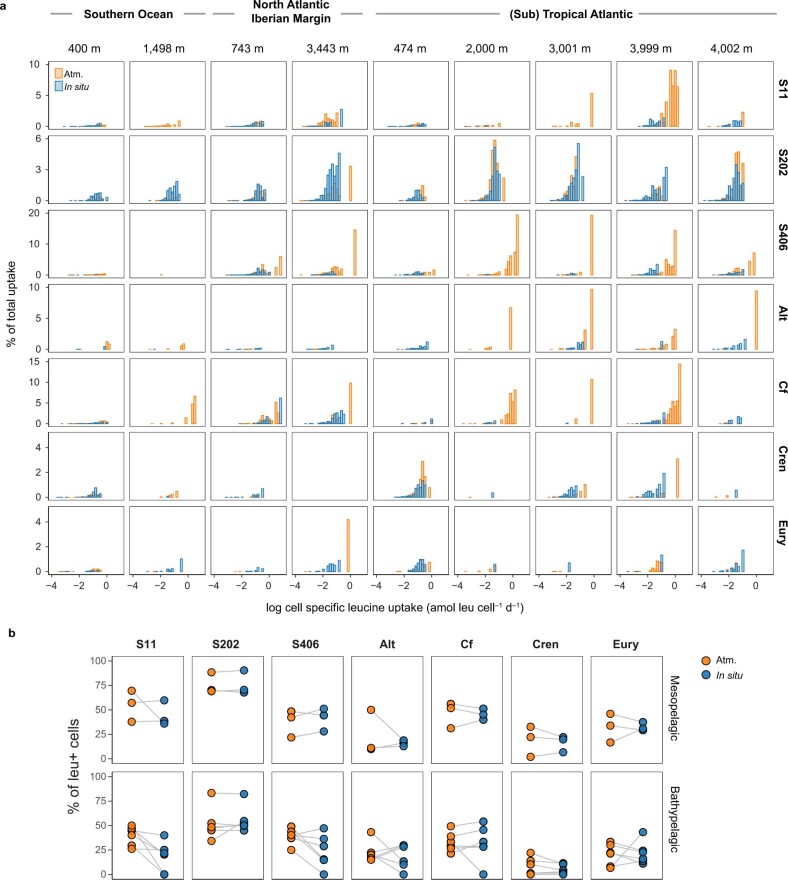
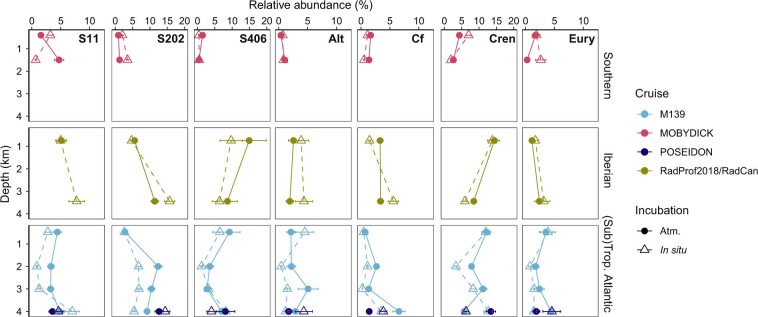
Deep-sea microbial communities are exposed to high-pressure conditions, which has a variable impact on prokaryotes depending on whether they are piezophilic (that is, pressure-loving), piezotolerant or piezosensitive. While it has been suggested that elevated pressures lead to higher community-level metabolic rates, the response of these deep-sea microbial communities to the high-pressure conditions of the deep sea is poorly understood. Based on microbial activity measurements in the major oceanic basins using an in situ microbial incubator, we show that the bulk heterotrophic activity of prokaryotic communities becomes increasingly inhibited at higher hydrostatic pressure. At 4,000 m depth, the bulk heterotrophic prokaryotic activity under in situ hydrostatic pressure was about one-third of that measured in the same community at atmospheric pressure conditions. In the bathypelagic zone-between 1,000 and 4,000 m depth-~85% of the prokaryotic community was piezotolerant and ~5% of the prokaryotic community was piezophilic. Despite piezosensitive-like prokaryotes comprising only ~10% (mainly members of Bacteroidetes, Alteromonas) of the deep-sea prokaryotic community, the more than 100-fold metabolic activity increase of these piezosensitive prokaryotes upon depressurization leads to high apparent bulk metabolic activity. Overall, the heterotrophic prokaryotic activity in the deep sea is likely to be substantially lower than hitherto assumed, with major impacts on the oceanic carbon cycling.

Keywords: Carbon cycle; Microbial biooceanography; Microbial ecology.


Conflict of interest statement

Competing interestsThe authors declare no competing interests.

Figures

Fig. 1
Fig. 1. In situ bulk leucine incorporation rates normalized to rates obtained at atmospheric pressure conditions.
Symbols correspond to the different research expeditions (Extended Data Fig. 1). Regression equation is a power law function: Pinsitu = 494z−0.321 (n = 56, number of samples incubated at in situ), where Pinsitu is the percentage of in situ leucine incorporation rate normalized to mean leucine incorporation rate under atmospheric pressure (Atm.) and z is depth (m). Shaded area indicates 95% confidence interval for the regression. Note that the data points at 0 m (n = 4) correspond to instrumental tests in which epi- to bathypelagic waters were incubated with the ISMI under atmospheric pressure conditions and compared with bottle incubations used for atmospheric pressure incubations to assess the potential bias associated with the instrument. These points are excluded from calculating the regression line. Source data
Fig. 2
Fig. 2. Cell-specific leucine uptake by prokaryotes.
a, Distribution of cell-specific leucine uptake expressed as the percentage of total active cell counts (upper panels) and the percentage of total uptake (lower panels). Water was collected at meso- and bathypelagic depths and incubated under in situ and atmospheric pressure (Atm.) conditions (Supplementary Tables 1 and 2). b, A microscopic view of a bathypelagic sample (2,000 m) collected in the Atlantic and incubated under atmospheric pressure conditions. Black halos around the cells are silver grains corresponding to their activities. The highly active cells (>0.5 amol Leu cell1 d1, indicated by arrows) were barely found in in situ pressure incubations. Typical low-activity cells in the bathypelagic depths are indicated by circles. Green fluorescence, EUB338 probe mix; light blue, DAPI-stained cells. Scale bar, 5 µm. c, Leucine uptake by taxonomical groups: S11, SAR11 clade; S202, SAR202 clade; S406, SAR406 clade; Alt, Alteromonas; Cf, Bacteroidetes; Cren, Thaumarchaeota; Eury, Euryarchaeota. The grey line connects the same location and depth between in situ and Atm. samples representing the change in leucine uptake beween the two incubation conditions. Source data
Fig. 3
Fig. 3. Depth-related changes in the metaproteome of three abundant deep-sea bacterial taxa.
a, Venn diagrams indicating the number of shared and unique up- and down-regulated proteins among Alteromonas, Bacteroidetes and SAR202 of meso- versus epipelagic layers, bathy- versus mesopelagic layers and bathy- versus epipelagic layers. Numbers indicate the protein abundance. Epi, epipelagic; Meso, mesopelagic; Bathy, bathypelagic waters. b, Comparison of expressed proteins produced by Alteromonas, Bacteroidetes and SAR202. Significance of the change between depth layers is indicated by different colours: not significant (NS), P ≥ 0.05; up-regulated proteins (Up), P < 0.05 and log2 fold change ≥1; down-regulated proteins (Down), P < 0.05 and log2 fold change ≤ −1. The P values are shown in Supplementary Data 1.
Extended Data Fig. 1
Extended Data Fig. 1. Sampling location of stations where the in situ microbial incubator (ISMI) was deployed and metaproteomic analyses were performed.
The ISMI was deployed during the M139 and POSEIDON cruise in the Atlantic Ocean, MODUPLAN, RadProf and RadCan cruises in the North Atlantic off the Iberian Peninsula, MOBYDICK cruise in the Southern Ocean, and SO248 cruise in the Pacific Ocean, and at the Ruđer Bošković Institute, Rovinj, Croatia. Numbers indicate station names. Numbers in brackets indicate the year when sampling was performed. The coordinates of the stations are indicated in Supplementary Table 1. Detailed information of the proteomics stations can be found elsewhere. The map was generated by The Generic Mapping Tools.
Extended Data Fig. 2
Extended Data Fig. 2. Overview of the ISMI.
a, The ISMI can be mounted on a rosette sampling system or lowered by the shipboard winch. b, Schematic overview of the ISMI. There is only one inlet (left side of the figure) and one outlet (right side) in the system. Prior to deployment, the substrate and the fixative reagent are added into the incubation and fixation cylindrical sampler, respectively. All tubes are pre-filled with either 0.2 µm filtered seawater or MilliQ water. Cylindrical samplers from No. 1 to 4 collect samples in this order by opening the clamps from No. 1 to 8. There is always a flushing step prior to the actual sampling. Incubations are performed either in duplicate or in triplicate.
Extended Data Fig. 3
Extended Data Fig. 3. Vertical distribution of leucine incorporation rates incubated under in situ and atmospheric pressure conditions.
Regressions: log (leucine incorporation) (pmol L–1 h–1) = –1.9z + 4.7 (atm.; n = 27, r2 = 0.87, P = 9.9 × 10⁻¹³); –2.3z + 5.6 (in situ; n = 27, r2 = 0.92, P = 3.9 × 10⁻¹⁵) where z is log depth in m. Sample size (n) indicates number of sites and depths (see Supplementary Table 1).
Extended Data Fig. 4
Extended Data Fig. 4. Taxon level response to the hydrostatic pressure.
a, Cell specific leucine uptake incubated under in situ and atmospheric pressure (Atm.) conditions expressed as percentage of total leucine uptake. b, Abundance of cells taking up leucine in percent of total abundance of the respective taxon. Target group are indicated as S11: SAR11, S202: SAR202 clade, S406: SAR406 clade, Alt: Alteromonas, Cf: Bacteroidetes, Cren: Thaumarchaeota, Eury: Euryarchaeota. Source data
Extended Data Fig. 5
Extended Data Fig. 5. Relative abundance of prokaryotes.
Error bar shows variations of technical and biological replicates calculated with coefficient of variations (CV). Randomly chosen technical and biological replicates for each taxonomic group were used to calculate the CV of relative abundance for the target groups; S11: SAR11 clade (n = 9), S202: SAR202 clade (n = 7), S406: SAR406 clade (n = 7), Alt: Alteromonas (n = 8), Cf: Bacteroidetes (n = 3), Cren: Thaumarchaeota (n = 11), Eury: Euryarchaeota (n = 8). Mean value of the CV was used to estimate the error.
Extended Data Fig. 6
Extended Data Fig. 6. Ratio of modelled particulate organic carbon (POC) supply rate and prokaryotic carbon demand (PCD) calculated from depressurized and in situ heterotrophic production rates in the Atlantic and the Pacific Ocean.
The particulate organic carbon (POC) potentially available at a specific depth is calculated using depth dependent sediment trap data and satellite derived net primary production estimates. The prokaryotic carbon demand assumes a grand average of 8% growth efficiency for the meso- and 3% for the bathypelagic waters. PCD was calculated using leucine to carbon conversion factors (CF) of a, 1.55 kg C mol–1 leu and b, 0.44 kg C mol–1 leu (see Methods). A ratio of 1 indicates that the POC supply rate matches PCD. Values <1 suggest inadequate supply of POC to support the PCD. Error bars indicate standards errors of the mean taking error propagation into account. Numbers in the panels indicate sample size.

References

    1. Aristegui J, Gasol JM, Duarte CM, Herndl GJ. Microbial oceanography of the dark ocean’s pelagic realm. Limnol. Oceanogr. 2009;54:1501–1529. doi: 10.4319/lo.2009.54.5.1501. - DOI
    1. Jannasch HW, Eimhjellen K, Wirsen CO, Farmanfarmaian A. Microbial degradation of organic matter in the deep sea. Science. 1971;171:672–675. doi: 10.1126/science.171.3972.672. - DOI - PubMed
    1. Tamburini C, Boutrif M, Garel M, Colwell RR, Deming JW. Prokaryotic responses to hydrostatic pressure in the ocean – a review. Environ. Microbiol. 2013;15:1262–1274. doi: 10.1111/1462-2920.12084. - DOI - PubMed
    1. Yayanos AA. Microbiology to 10,500 meters in the deep-sea. Annu. Rev. Microb. 1995;49:777–805. doi: 10.1146/annurev.mi.49.100195.004021. - DOI - PubMed
    1. Jebbar M, Franzetti B, Girard E, Oger P. Microbial diversity and adaptation to high hydrostatic pressure in deep-sea hydrothermal vents prokaryotes. Extremophiles. 2015;19:721–740. doi: 10.1007/s00792-015-0760-3. - DOI - PubMed