. 2022 Nov 24:9:1063620.
doi: 10.3389/fmolb.2022.1063620. eCollection 2022.

Effect of naturally-occurring mutations on the stability and function of cancer-associated NQO1: Comparison of experiments and computation

Affiliations

Effect of naturally-occurring mutations on the stability and function of cancer-associated NQO1: Comparison of experiments and computation

Juan Luis Pacheco-Garcia et al. Front Mol Biosci. .

Abstract

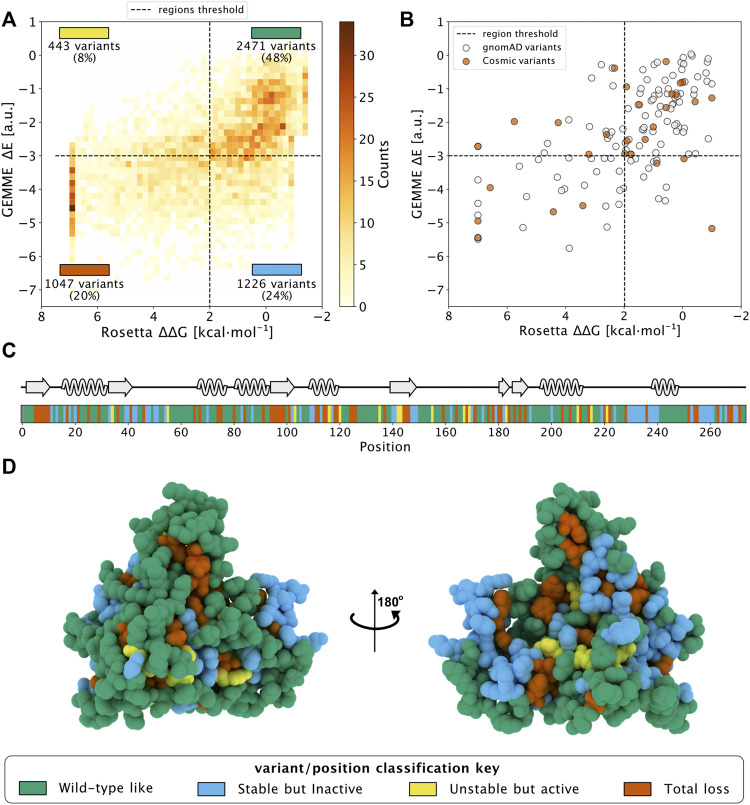
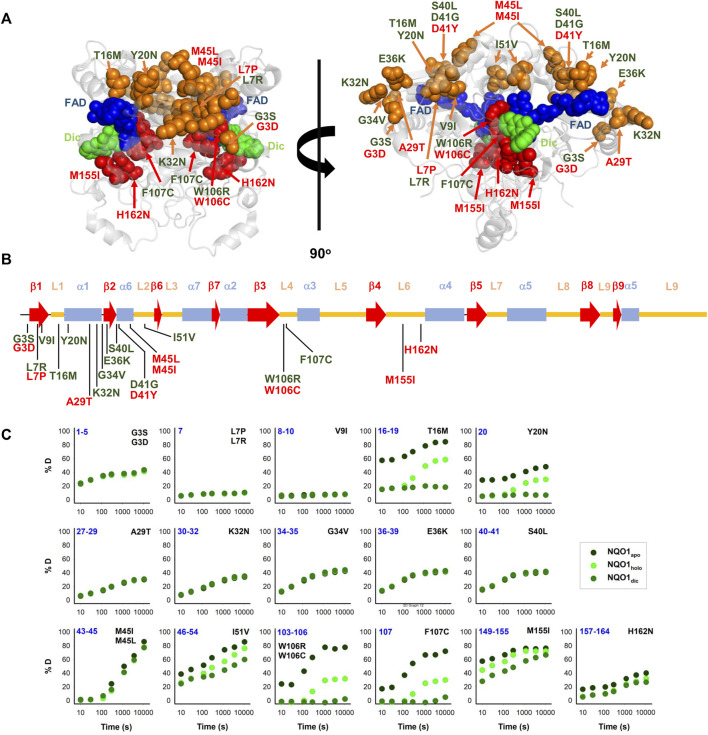
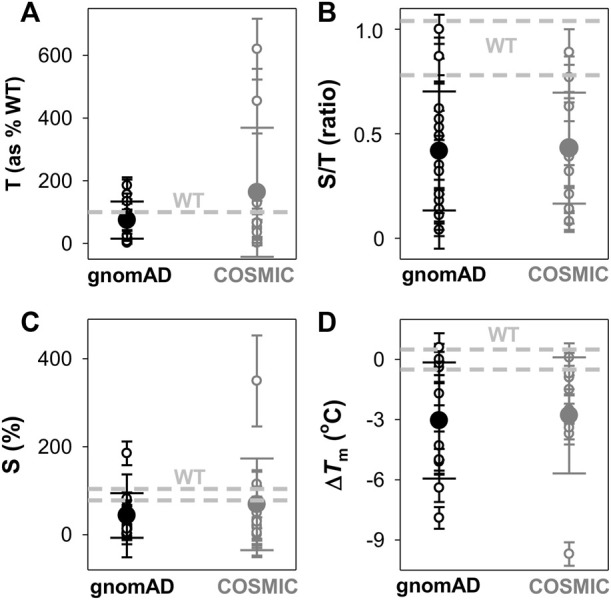
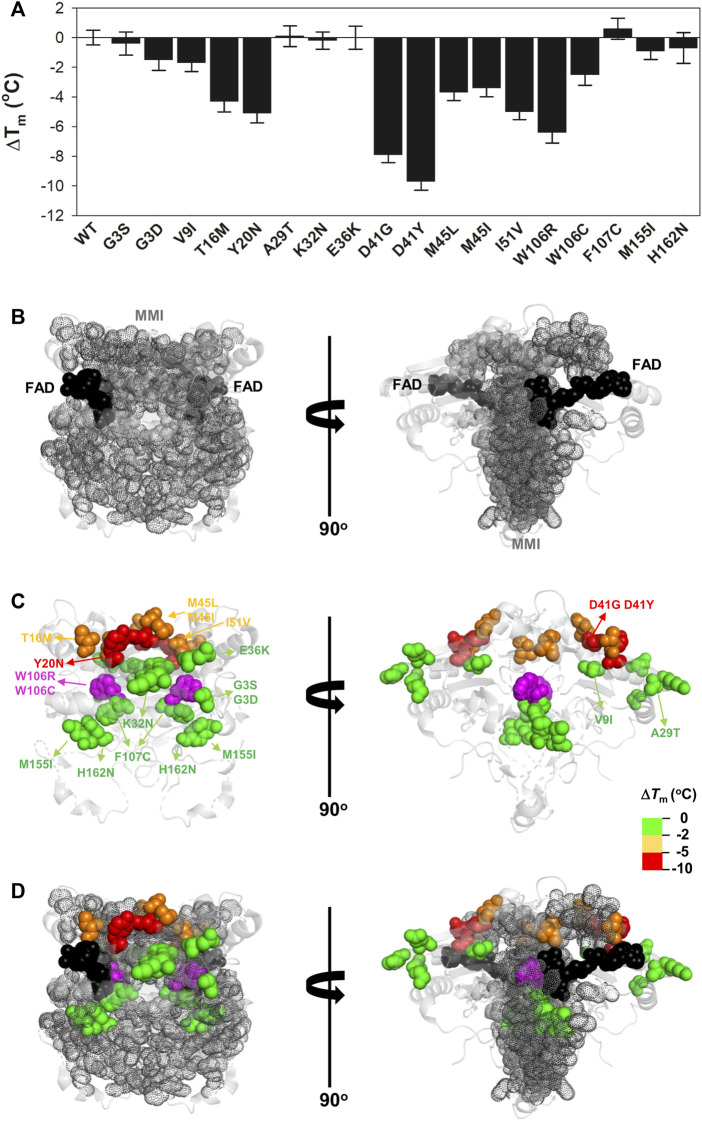
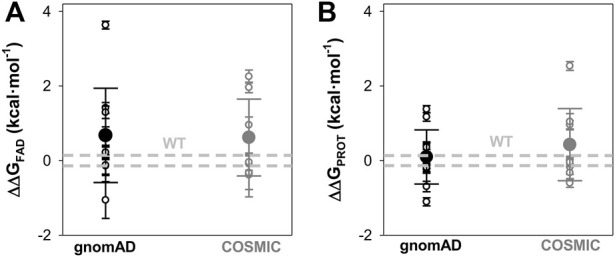
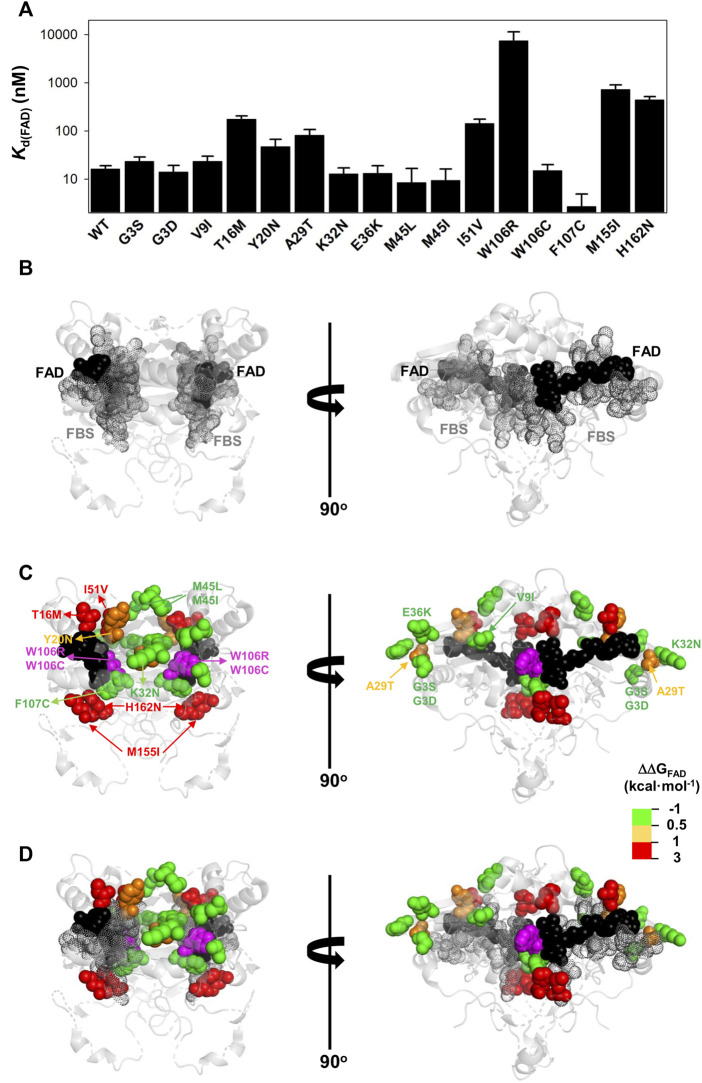
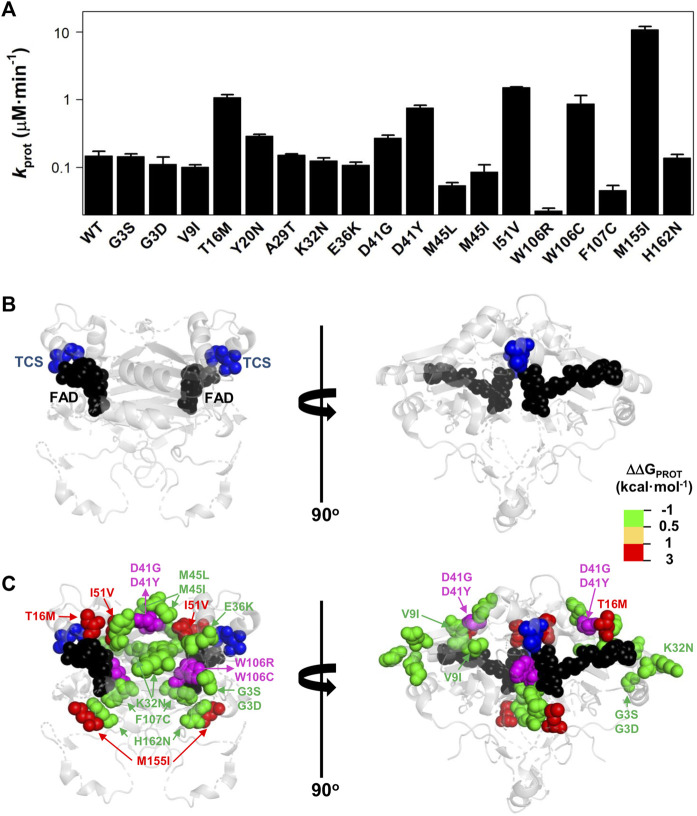
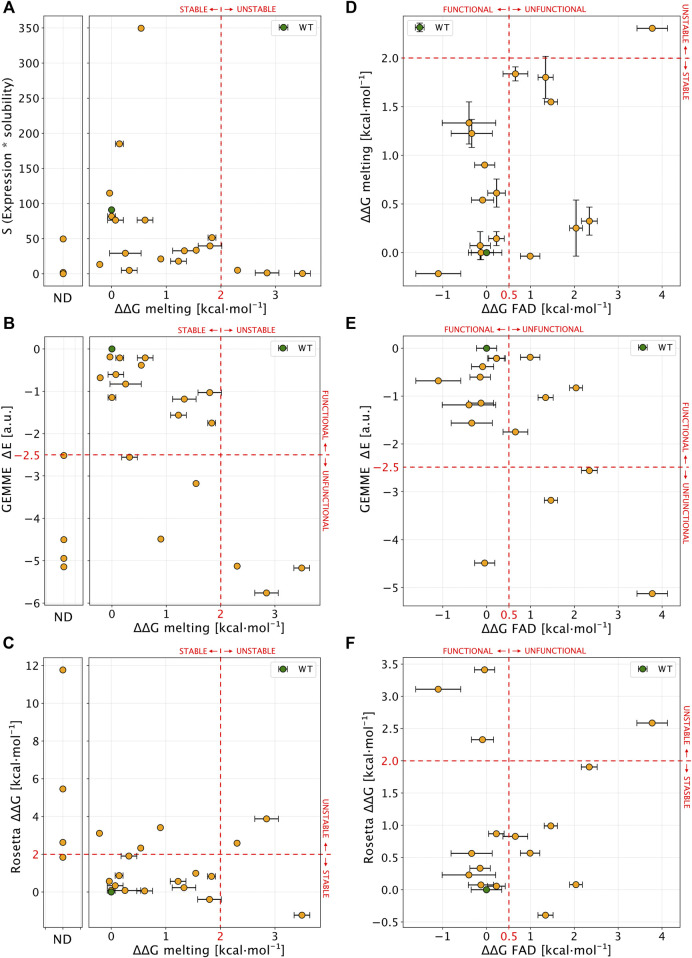
Recent advances in DNA sequencing technologies are revealing a large individual variability of the human genome. Our capacity to establish genotype-phenotype correlations in such large-scale is, however, limited. This task is particularly challenging due to the multifunctional nature of many proteins. Here we describe an extensive analysis of the stability and function of naturally-occurring variants (found in the COSMIC and gnomAD databases) of the cancer-associated human NAD(P)H:quinone oxidoreductase 1 (NQO1). First, we performed in silico saturation mutagenesis studies (>5,000 substitutions) aimed to identify regions in NQO1 important for stability and function. We then experimentally characterized twenty-two naturally-occurring variants in terms of protein levels during bacterial expression, solubility, thermal stability, and coenzyme binding. These studies showed a good overall correlation between experimental analysis and computational predictions; also the magnitude of the effects of the substitutions are similarly distributed in variants from the COSMIC and gnomAD databases. Outliers in these experimental-computational genotype-phenotype correlations remain, and we discuss these on the grounds and limitations of our approaches. Our work represents a further step to characterize the mutational landscape of NQO1 in the human genome and may help to improve high-throughput in silico tools for genotype-phenotype correlations in this multifunctional protein associated with disease.

Keywords: computational prediction; genotype-phenotype correlations; protein function; protein stability; sequence conservation.


Conflict of interest statement

The authors declare that the research was conducted in the absence of any commercial or financial relationships that could be construed as a potential conflict of interest.

Figures

FIGURE 1
FIGURE 1
Saturation mutagenesis of NQO1 based on computational methods. (A) Two-dimensional histogram which combines the data from the evolutionary conservation analysis (ΔE, y-axis) with the thermodynamic stability (ΔΔG, x-axis) data from Rosetta on the NQQ1 monomer. The variants are categorized in one of the four regions, which are delimited by dashed lines. The fraction of variants, class and colour assigned to each region are indicated. The four classes of variants/positions are reported at the bottom of the figure: “WT-like” (Green), “Low stability, active” (yellow), “Stable but inactive” (blue) and “Total-loss” (red). (B) The scores of gnomAD (grey) and COSMIC (orange) variants in the 2D histogram. (C) The positional colour categories assigned using the most common colour of the position in the sequence together with the secondary structure. (D) The positional classification mapped to the protein crystal structure (PDB: 1D4A) (Faig et al., 2000).
FIGURE 2
FIGURE 2
Structural features and local stability of the substituted residues and the variants characterized experimentally in this work. (A) The residues mutated were mapped onto the structure of NQO1 (PDB code 2F1O) (Asher et al., 2006). Residues are depicted as spheres, and the colour code indicates substitutions located in the 1–51 region (orange) or the active site (red). Variants were labelled in red (from COSMIC) or in green (from gnomAD). FAD and Dic are shown as dot representations in cyan and blue, respectively. (B) Location of substitutions in the sequence of NQO1 regarding secondary structure elements (from (Faig et al., 2000)). Substitutions were labelled in red (from COSMIC) or in green (from gnomAD). (C) HDX of segments containing the 22 variants experimentally investigated in this work. The segments are labelled in blue. The colour code corresponds to HDX for NQO1apo, NQO1holo and NQO1dic states. HDX data are from (Vankova et al., 2019).
FIGURE 3
FIGURE 3
Overall effects of gnomAD and COSMIC variations on the solubility/aggregation propensity and thermal stability of the NQO1 protein. (A–C) Expression analyses of solubility/aggregation propensity of NQO1 variants in E.coli at 37oC. The total amount of NQO1 protein [T, (A)] as well as the ratio of soluble/total (S/T) protein (B) were determined from induced cells sonicated before (T) and after (S) centrifugation at 21,000 g. The levels of NQO1 protein were determined by western-blotting (Supplementary Figure S3). The amount of soluble protein (S) is calculated as the product of T and S/T and shown in (C). Data are the mean ± s.d. from at least three independent expression experiments for each variant; (D) Thermal stability of NQO1 variants as holo-proteins. ΔT m values correspond to the difference between a given variant and the WT protein. Data are the mean ± s.d. from three-six technical replicas. Small circles indicate the effects of individual variants and large circles (and corresponding errors) are those for each data set (mean ± s.d.). For reference, the values corresponding to WT NQO1 are shown in light grey. Variants are grouped in the gnomAD and COSMIC sets.
FIGURE 4
FIGURE 4
Variant effects on thermal stability related to their location near the MMI or the bound FAD. (A) Experimental ΔT m values for individual variants; (B–D) Structural location of the FAD (black spheres) and the MMI (grey dots) (B) and mutated residues (colour scale according to their destabilizing effect) (C). (D) shows an overlay of (B,C). Note that two views rotated 90° are shown. The structural model used for display was PDB code 2F1O (Asher et al., 2006). The residue W106 is highlighted in magenta due to the widely different effects of the W106R/W106C substitutions.
FIGURE 5
FIGURE 5
Overall effects of gnomAD and COSMIC mutations on the FAD binding affinity and the local stability of the FAD binding site (FBS). (A) Changes in apparent FAD binding free energies (ΔΔGFAD) calculated from the difference of binding affinity between WT and a given variant from titrations. Errors are those from linear propagation; (B) Local stability of the TCS (next to the FBS) from proteolysis kinetics. Changes in local stability (ΔΔGPROT) calculated from the difference of the second-order rate constant between WT and a given variant. Errors are those from linear propagation; For reference, the values corresponding to WT NQO1 are shown in light grey. Variants are grouped in the gnomAD and COSMIC sets.
FIGURE 6
FIGURE 6
Variant effects on the FAD binding affinity. (A) FAD binding affinity of each variant was determined by titrations of apo-proteins. At least two independent experiments were carried out for each variant and fitted using a single-type-of-independent binding sites to obtain K d values (note the logarithmic scale of the y-axis). Errors are those fittings. These K d values were used to calculate the binding free energy difference (ΔΔGFAD) between a given variant and the WT protein (note that a positive value indicates lower affinity). (B–D) Structural location of the FAD (black spheres) and the FBS (grey dots) (B) and mutated residues (colour scale according to their destabilizing effect on FAD binding) (C). The residue W106 is highlighted in magenta due to the widely different effects of the W106R/W106C substitutions. (D) shows an overlay of (B,C). Note that two views rotated 90° are shown. The structural model used for display was PDB code 2F1O (Asher et al., 2006).
FIGURE 7
FIGURE 7
Variant effects on the local stability of the FBS from proteolysis. (A) Second-order rate constants for proteolysis of NQO1 variants (Supplementary Figure S5C). Errors are those fittings. These k PROT values were used to calculate the TCS local energy free difference (ΔΔGPROT) between a given variant and the WT protein (note that a positive value indicates lower affinity). (B,C) Structural location of the FAD (black spheres) and the TCS (blue spheres) (B). In (C), mutated residues (colour scale according to their destabilizing effect on FAD binding) (C) are overlayed with TCS and FAD. The residues D41 and W106 are highlighted in magenta due to the widely different effects of the D41G/D41Y and W106R/W106C substitutions. Note that two views rotated 90° are shown. The structural model used for display was PDB code 2F1O (Asher et al., 2006).
FIGURE 8
FIGURE 8
Comparison of experimental results with computational scores. (A) Scatter plot of ΔΔGmelting (x-axis) and S values (expression * solubility). Not-determined variants (ND) in thermal stability experiment are reported in a separate plot. (B,C) show a comparison between ΔΔGmelting and computational predictors. (D) Correlation between ΔΔGmelting and ΔΔGFAD for NQO1 variants detected in both the experiments. (E,F) Comparison of ΔΔGFAD with the computational results. Red lines, if present, show the boundary of experimental and computational classes for each comparison. In each panel errors are reported as a black bar on every single variant, if present.

Similar articles

Cited by

References

    1. Abildgaard A. B., Stein A., Nielsen S. V., Schultz-Knudsen K., Papaleo E., Shrikhande A., et al. (2019). Computational and cellular studies reveal structural destabilization and degradation of MLH1 variants in Lynch syndrome. Elife 8, e49138. 10.7554/eLife.49138 - DOI - PMC - PubMed
    1. Anoz-Carbonell E., Timson D. J., Pey A. L., Medina M. (2020). The catalytic cycle of the antioxidant and cancer-associated human NQO1 enzyme: Hydride transfer, conformational dynamics and functional cooperativity. Antioxidants 9, 772. 10.3390/antiox9090772 - DOI - PMC - PubMed
    1. Arnedo-Pac C., Lopez-Bigas N., Muiños F. (2022). Predicting disease variants using biodiversity and machine learning. Nat. Biotechnol. 40, 27–28. 10.1038/s41587-021-01187-w - DOI - PubMed
    1. Asher G., Dym O., Tsvetkov P., Adler J., Shaul Y. (2006). The crystal structure of NAD(P)H quinone oxidoreductase 1 in complex with its potent inhibitor dicoumarol. Biochemistry 45, 6372–6378. 10.1021/bi0600087 - DOI - PubMed
    1. Asher G., Tsvetkov P., Kahana C., Shaul Y. (2005). A mechanism of ubiquitin-independent proteasomal degradation of the tumor suppressors p53 and p73. Genes Dev. 19, 316–321. 10.1101/gad.319905 - DOI - PMC - PubMed