. 2022 Oct 17;4(23):5178-5188.
doi: 10.1039/d2na00406b. eCollection 2022 Nov 22.

A combined experimental and molecular simulation study on stress generation phenomena during the Ziegler-Natta polyethylene catalyst fragmentation process

Affiliations

A combined experimental and molecular simulation study on stress generation phenomena during the Ziegler-Natta polyethylene catalyst fragmentation process

Antonio De Nicola et al. Nanoscale Adv. .

Abstract

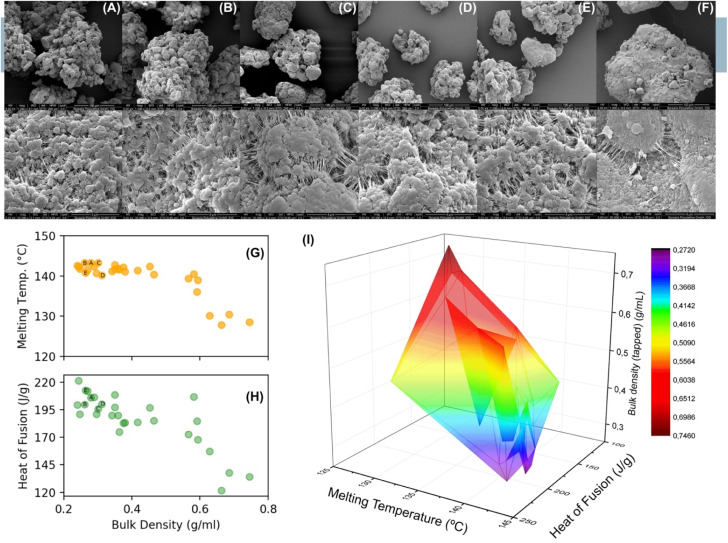
The morphology of particles obtained under different pre-polymerization conditions has been connected to the stress generation mechanism at the polymer/catalyst interface. A combination of experimental characterization techniques and atomistic molecular dynamics simulations allowed a systematic investigation of experimental conditions leading to a certain particle morphology, and hence to a final polymer with specific features. Atomistic models of nascent polymer phases in contact with magnesium dichloride surfaces have been developed and validated. Using these detailed models, in the framework of McKenna's hypothesis, the pressure increase due to the polymerization reaction has been calculated under different conditions and is in good agreement with experimental scenarios. This molecular scale knowledge and the proposed investigation strategy would allow the pre-polymerization conditions to be better defined and the properties of the nascent polymer to be tuned, ensuring proper operability along the whole polymer production process.


Conflict of interest statement

There are no conflicts to declare.

Figures

Scheme 1
Scheme 1. Industrial flow-chart process of a typical fourth-generation plant for polyethylene polymerization.
Scheme 2
Scheme 2. (a) Schematic representation of the fragmentation process. On the left a particle with no active polymerization reaction is shown. When the polymerization takes place, from the catalyst surface, the polymer starts to fill the pore more and more. The stress is accumulated up to fragmentation (particle on the right). Limiting scenarios for the catalytic support fragmentation proposed by McKenna: (b) crystalline polymer cannot flow out of pores and large stress is accumulated on the walls (black arrows). (c) Amorphous polymer flowing out (most of the stress is released laterally, black arrows). A bi-dimensional finite pore is considered for simplicity.
Fig. 1
Fig. 1. SEM images of polyethylene samples (panels A–F) produced under different temperature conditions (A: 313 K, B and C: 323 K, D: 323 K and H2, E: 353 K, F: 343 K and C6), and/or with different compositions (B and C: different C2 concentrations; D: with H2. Top: 1000×; bottom: 300 00×). Melting temperature (G) and heat of fusion (H) of the produced polymer as a function of the bulk density. The DSC technique has been used to measure the melting temperature and heat of fusion of the polymer (first heating scan). (I) 3D plot correlating the bulk density and both the properties of the polymer produced, heat of fusion (crystallinity degree of PE) and melting temperature (lamella dimension).
Fig. 2
Fig. 2. (a) Mass density profile calculated for a system composed of PE chains in contact with the (110) surface of a crystalline slab of MgCl2 at a T = 500 K. (b) Next to the plot, a snapshot representing the equilibrium state is reported. The PE polymer chains are in green, while the magnesium and chlorine atoms are in red and cyan, respectively.
Fig. 3
Fig. 3. (a) Temporal variation of PE mass density, for the system PE in contact with a crystalline slab of MgCl2, during the first 100 ns of the fast quenching procedure. (b) Density isosurfaces of PE (in green) at different stages of simulation. The MgCl2 bead support is reported together with the isosurfaces. (c) Snapshot sequence of selected chains. Selected chains belong to spatial regions with a mass density 1.3 times larger than the average density of the last configuration. (d) Mass density profiles of amorphous (blue line) and semi-crystalline (red line) phases of PE in contact with a crystalline slab of MgCl2 (black discontinuous line). Profiles in panels (d) and (e) are calculated in the direction normal to the MgCl2 surface and time averaged over the last 50 ns of NPT production runs. (e) Orientational order parameter P2 as a function of the distance r from the surface. The final configuration has a degree of crystallinity of ∼68%, like those obtained from the homogeneous melt using the same quenching procedure (see the ESI for further details).
Fig. 4
Fig. 4. (a) Pressure increases (ΔP) of amorphous and semi-crystalline PE in contact with the MgCl2 110 surface as a function of the number of inserted monomers number per unit area. On the left side of the same panel, a scheme illustrating the interfaces at which the pressure increase is generated is reported. ΔP is calculated as the difference between the pressure after insertion of a monomer and the equilibrium pressure (1 bar) in the absence of monomer insertion. (b) Snapshots illustrating the partially filled (left side) and filled pore (right side), in the filled pore models the periodicity of the simulation box is set to avoid any polymer vacuum interface (the polymer atoms on the upper side interact with those on the lower side).
Fig. 5
Fig. 5. (a) ΔP increases for: semi-crystalline pure system (orange points), with a load of [0.1 M] of H2 (blue points), with a load of 3% of C2 (black points) and with a load of C6 3% (green points). (b) P2 order parameter calculated in the direction normal to the MgCl2 surface. (c) Snapshot of semi-crystalline PE in contact with MgCl2 with a load of 0.1 M of H2. Amorphous and crystal domains are identified by a contour to highlight the different distributions of hydrogen atoms in the polymer matrix.

References

    1. Vollmer I. Jenks M. J. F. Roelands M. C. P. White R. J. Harmelen T. Wild P. Laan G. P. Meirer F. Keurentjes J. T. F. Weckhuysen B. M. Angew. Chem., Int. Ed. 2020;59:15402–15423. doi: 10.1002/anie.201915651. - DOI - PMC - PubMed
    1. Rahimi A. García J. M. Nat. Rev. Chem. 2017;1:0046. doi: 10.1038/s41570-017-0046. - DOI
    1. Sauter D. Taoufik M. Boisson C. Polymers. 2017;9:185. doi: 10.3390/polym9060185. - DOI - PMC - PubMed
    1. Soares J. B. P., McKenna T. F. L., Polyolefin Reaction Engineering, Wiley-VCH Verlag GmbH & Co. KGaA, Weinheim, Germany, 2012, pp. 87–129, ISBN: 978-3-527-31710-3
    1. Zhou Y. Alizadeh A. Liu B. Soares J. B. P. Macromol. React. Eng. 2021;15:2000043. doi: 10.1002/mren.202000043. - DOI