

Depth wide distribution and metabolic potential of chemolithoautotrophic microorganisms reactivated from deep continental granitic crust underneath the Deccan Traps at Koyna, India
- PMID: 36504802
- PMCID: PMC9731672
- DOI: 10.3389/fmicb.2022.1018940
Depth wide distribution and metabolic potential of chemolithoautotrophic microorganisms reactivated from deep continental granitic crust underneath the Deccan Traps at Koyna, India
Abstract
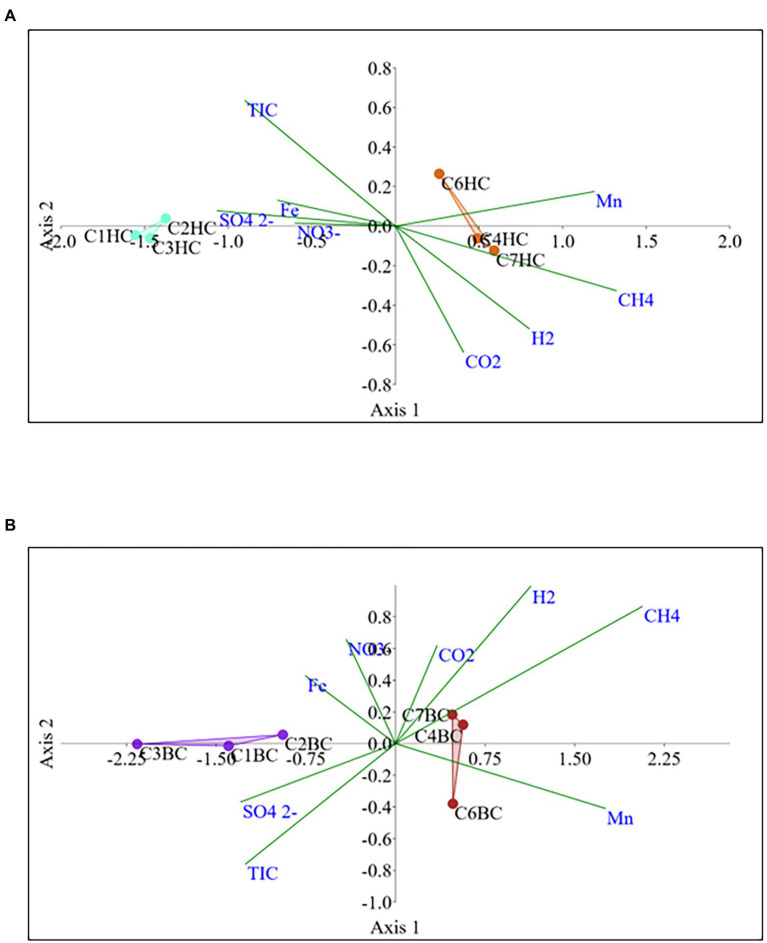
Characterization of inorganic carbon (C) utilizing microorganisms from deep crystalline rocks is of major scientific interest owing to their crucial role in global carbon and other elemental cycles. In this study we investigate the microbial populations from the deep [up to 2,908 meters below surface (mbs)] granitic rocks within the Koyna seismogenic zone, reactivated (enriched) under anaerobic, high temperature (50°C), chemolithoautotrophic conditions. Subsurface rock samples from six different depths (1,679-2,908 mbs) are incubated (180 days) with CO2 (+H2) or HCO3 - as the sole C source. Estimation of total protein, ATP, utilization of NO3 - and SO4 2- and 16S rRNA gene qPCR suggests considerable microbial growth within the chemolithotrophic conditions. We note a better response of rock hosted community towards CO2 (+H2) over HCO3 -. 16S rRNA gene amplicon sequencing shows a depth-wide distribution of diverse chemolithotrophic (and a few fermentative) Bacteria and Archaea. Comamonas, Burkholderia-Caballeronia-Paraburkholderia, Ralstonia, Klebsiella, unclassified Burkholderiaceae and Enterobacteriaceae are reactivated as dominant organisms from the enrichments of the deeper rocks (2335-2,908 mbs) with both CO2 and HCO3 -. For the rock samples from shallower depths, organisms of varied taxa are enriched under CO2 (+H2) and HCO3 -. Pseudomonas, Rhodanobacter, Methyloversatilis, and Thaumarchaeota are major CO2 (+H2) utilizers, while Nocardioides, Sphingomonas, Aeromonas, respond towards HCO3 -. H2 oxidizing Cupriavidus, Hydrogenophilus, Hydrogenophaga, CO2 fixing Cyanobacteria Rhodobacter, Clostridium, Desulfovibrio and methanogenic archaea are also enriched. Enriched chemolithoautotrophic members show good correlation with CO2, CH4 and H2 concentrations of the native rock environments, while the organisms from upper horizons correlate more to NO3 -, SO4 2- , Fe and TIC levels of the rocks. Co-occurrence networks suggest close interaction between chemolithoautotrophic and chemoorganotrophic/fermentative organisms. Carbon fixing 3-HP and DC/HB cycles, hydrogen, sulfur oxidation, CH4 and acetate metabolisms are predicted in the enriched communities. Our study elucidates the presence of live, C and H2 utilizing Bacteria and Archaea in deep subsurface granitic rocks, which are enriched successfully. Significant impact of depth and geochemical controls on relative distribution of various chemolithotrophic species enriched and their C and H2 metabolism are highlighted. These endolithic microorganisms show great potential for answering the fundamental questions of deep life and their exploitation in CO2 capture and conversion to useful products.
Keywords: Koyna seismogenic zone; chemolithotrophic microorganisms; deep biosphere; inorganic carbon metabolism; terrestrial subsurface granitic rock.
Copyright © 2022 Mandal, Bose, Ramesh, Sahu, Saha, Sar and Kazy.
Conflict of interest statement
The authors declare that the research was conducted in the absence of any commercial or financial relationships that could be construed as a potential conflict of interest.
Figures


Similar articles
-
Archaeal Communities in Deep Terrestrial Subsurface Underneath the Deccan Traps, India.Front Microbiol. 2019 Jul 16;10:1362. doi: 10.3389/fmicb.2019.01362. eCollection 2019. Front Microbiol. 2019. PMID: 31379755 Free PMC article.
-
Microbial diversity and function in crystalline basement beneath the Deccan Traps explored in a 3 km borehole at Koyna, western India.Environ Microbiol. 2022 Jun;24(6):2837-2853. doi: 10.1111/1462-2920.15867. Epub 2021 Dec 20. Environ Microbiol. 2022. PMID: 34897962
-
Exploration of deep terrestrial subsurface microbiome in Late Cretaceous Deccan traps and underlying Archean basement, India.Sci Rep. 2018 Nov 29;8(1):17459. doi: 10.1038/s41598-018-35940-0. Sci Rep. 2018. PMID: 30498254 Free PMC article.
-
Biogeochemistry of dihydrogen (H2).Met Ions Biol Syst. 2005;43:9-48. doi: 10.1201/9780824751999.ch2. Met Ions Biol Syst. 2005. PMID: 16370113 Review.
-
Paleo-Rock-Hosted Life on Earth and the Search on Mars: A Review and Strategy for Exploration.Astrobiology. 2019 Oct;19(10):1230-1262. doi: 10.1089/ast.2018.1960. Epub 2019 Jun 25. Astrobiology. 2019. PMID: 31237436 Free PMC article. Review.
Cited by
-
Elevation-dependent shifts in soil phosphorus forms and phosphorus-solubilizing microbial diversity suggest enhanced bioavailable phosphorus cycling with rising temperatures.Microbiol Spectr. 2025 Aug 5;13(8):e0130024. doi: 10.1128/spectrum.01300-24. Epub 2025 Jul 9. Microbiol Spectr. 2025. PMID: 40631746 Free PMC article.
References
-
- Adhikari R. R., Kallmeyer J. (2010). Detection and quantification of microbial activity in the subsurface. Geochemistry 70, 135–143. doi: 10.1016/j.chemer.2010.05.003 - DOI
-
- Alain K., Vince E., Courtine D., Maignien L., Zeng X., Shao Z., et al. . (2021). Thermococcus henrietii sp. nov., a novel extreme thermophilic and piezophilic sulfur-reducing archaeon isolated from a deep-sea hydrothermal chimney. Int. J. Syst. Evol. Microbiol. 71:004895. doi: 10.1099/ijsem.0.004895, PMID: - DOI - PubMed
-
- Amend J. P., Teske A. (2005). Expanding frontiers in deep subsurface microbiology. Palaeogeogr. Palaeoclimatol. Palaeoecol. 219, 131–155. doi: 10.1016/j.palaeo.2004.10.018 - DOI
LinkOut - more resources
Full Text Sources
Research Materials
Miscellaneous