. 2022 Nov 15;12(11):5271-5285.
eCollection 2022.

Elevated bile acid metabolism and microbiome are associated with suppressed cell proliferation and better survival in breast cancer

Affiliations

Elevated bile acid metabolism and microbiome are associated with suppressed cell proliferation and better survival in breast cancer

Rongrong Wu et al. Am J Cancer Res. .

Abstract

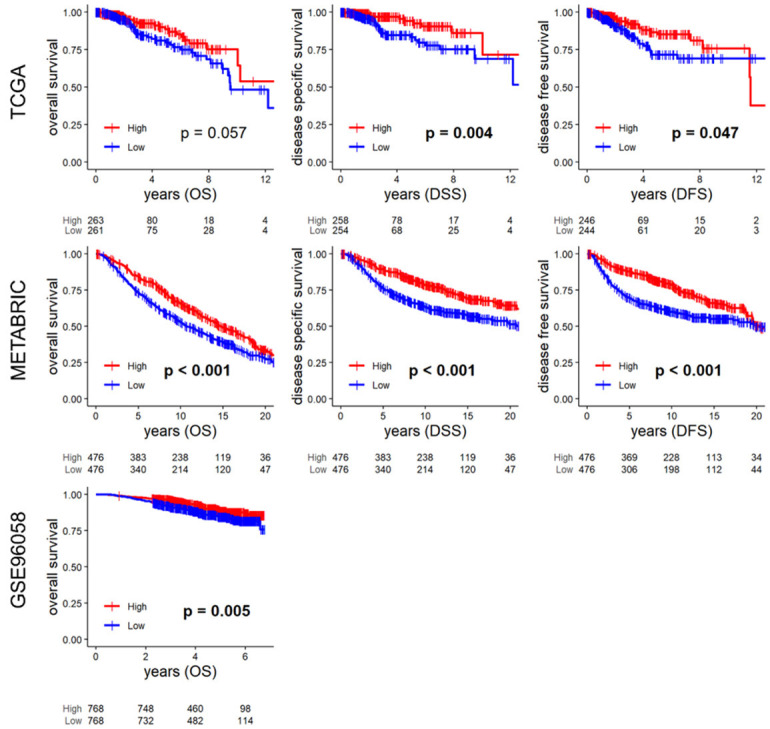
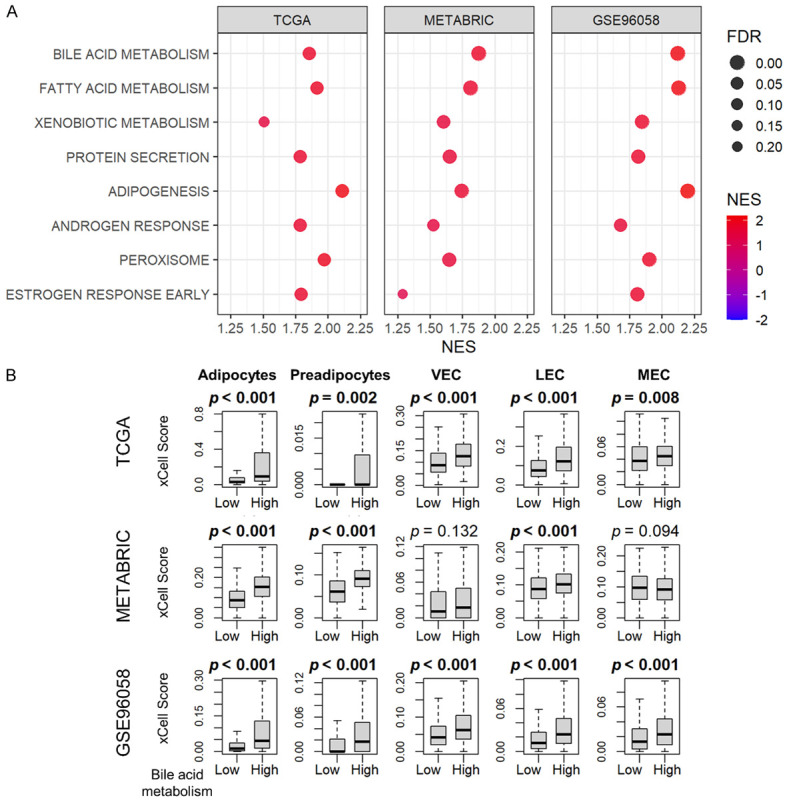
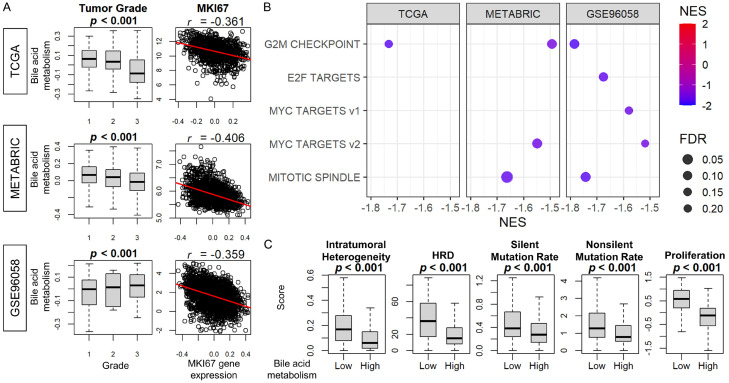
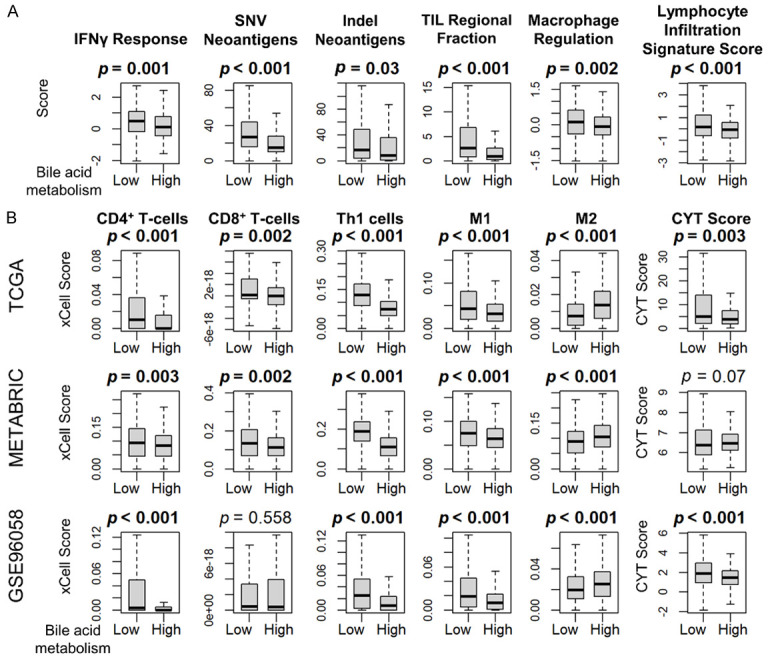
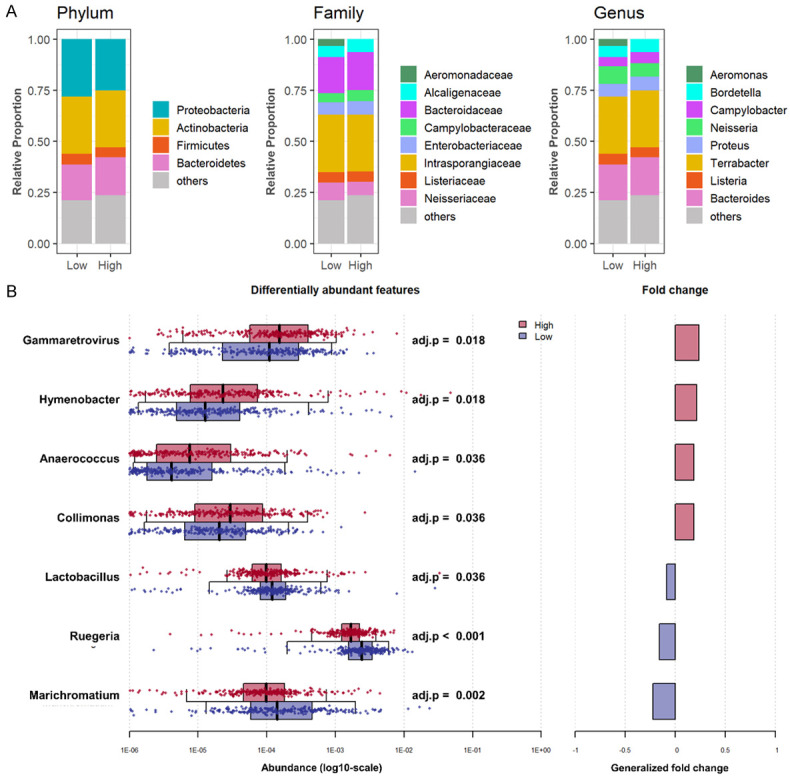
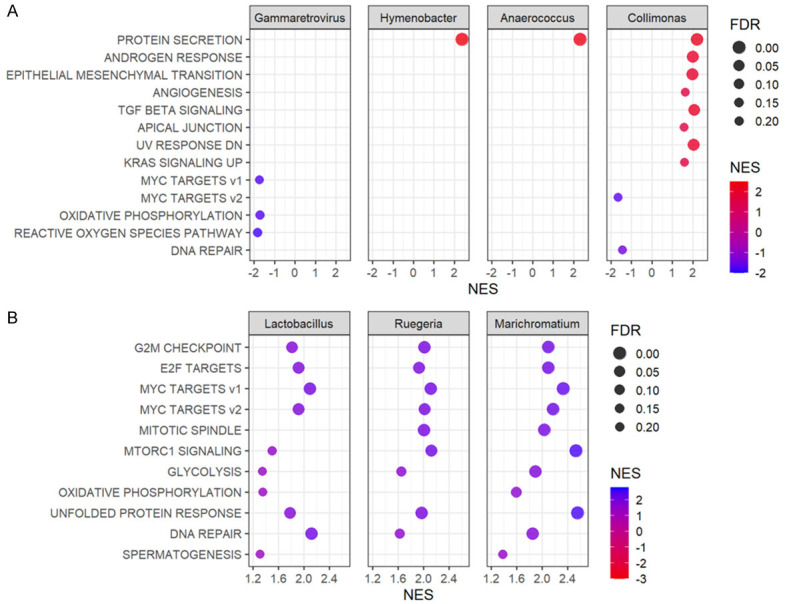
Bile acids are metabolized by the gut microbiome and are involved in fat absorption. Contrary to their carcinogenic role in gastrointestinal cancers, bile acids have been reported to inhibit cancer cell proliferation in breast cancer. The microbiome of breast cancer tissues may also influence cancer proliferation. We hypothesized that bile acid metabolism reflects its accumulation and is associated with certain microbiomes, breast cancer biology, and patient survival. Transcriptomic and clinicopathological information of a total of 6050 patients in three large open primary breast cancer cohorts (GSE96058, METABRIC, TCGA) and 16S rRNA gene sequence microbiome data of breast cancer tissues in TCGA were analyzed by high and low bile acid metabolism scores calculated by gene set variation analysis (GSVA). Breast cancers with high bile acid metabolism had a significantly improved survival across all three cohorts. Metabolic pathways related to the production and regulation of bile acids were consistently enriched in high bile acid metabolism groups across all cohorts. On the other hand, the low bile acid metabolism group was associated with higher Ki67 expression and Nottingham histological grade, as well as enrichment of cell proliferation-related gene sets. Intratumoral heterogeneity, homologous recombination deficiency, mutational load, activation of cancer immunity, and infiltration of anticancer immune cells were also higher in this group. Gammaretrovirus, Hymenobacter, Anaerococcus, and Collimonas were significantly more abundant in the high bile acid metabolism group compared to Lactobacillus, Ruegeria, and Marichromatium in the low metabolism group. Surprisingly, almost all Hallmark cell proliferation-associated gene sets were highly enriched in all three microorganisms that were abundant in the low bile acid metabolism group. In conclusion, microorganisms abundant in the breast tumor microenvironment with low bile acid metabolism are associated with aggressive cancer biology, including increased cell proliferation and poor survival.

Keywords: BRCA; Bile acid; GSVA; breast cancer; microbiome; tumor microenvironment.


Conflict of interest statement

None.

Figures

Figure 1
Figure 1
Survival analyses by bile acid metabolism score. Kaplan-Meier survival curves of the overall survival (OS), disease-specific survival (DSS), disease-free survival (DFS) in TCGA, METABRIC, and OS of the GSE96058 cohort. High and low groups were defined as the upper and lower quartiles of the bile acid metabolism score of each cohort. High groups are indicated by red lines, low groups by blue lines. Numbers at the bottom of the panels indicate the number of samples in each group. Statistical analysis was performed by Log-rank test, and P < 0.05 was considered significant.
Figure 2
Figure 2
GSEA and cell fractions of the high bile acid metabolism group. A. Dot plots show the gene sets that are significantly enriched in the high bile acid metabolism group (upper quartile) by GSEA in the TCGA, METABRIC, and GSE96058 cohorts. The horizontal scale and the color of each dot indicate normalized enrichment score (NES), and the size of each dot indicates false discovery rate (FDR). FDR less than 0.25 is considered significant. B. Box-and-whisker plots show the cell fractions of adipocytes, preadipocytes, vascular endothelial cell (VEC), lymphatic endothelial cell (LEC), and mesangial endothelial cells (MEC) according to the high and low bile acid scores (upper and lower quartiles) in the TCGA, METABRIC, and GSE96058 cohorts. All two-group comparisons were performed using the Wilcoxon signed-rank test. The error bars in each boxplot show the 95% confidence interval. The line in the box shows the median, and the top and bottom show the 25th and 75th percentiles respectively.
Figure 3
Figure 3
The association of bile acid metabolism and Nottingham histological grade, MKi67 expression, Hallmark cell proliferation-related gene sets, intratumoral heterogeneity, HRD, and mutation rates. A. Box-and-whisker plots of bile acid metabolism score by Nottingham histological grade in the TCGA, METABRIC, and GSE96058 cohorts. Scatter plots show the correlation between MKI67 gene expression and the score. B. Dot plots show the gene sets significantly enriched in the low bile acid metabolism group (lower quartile) by GSEA in the TCGA, METABRIC, and GSE96058 cohorts. The horizontal scale and the color of each dot indicate normalized enrichment score (NES), and the size of each dot indicates false discovery rate (FDR). FDR less than 0.25 was considered significant. C. Box-and-whisker plots show intratumoral heterogeneity, homologous recombination defects (HRD), silent or non-silent mutation rate, and proliferation scores according to the high and low bile acid scores (upper and lower quartiles) in TCGA. Multiple group comparisons were performed using the Kruskal-Wallis test and two-group comparisons were performed using the Wilcoxon signed-rank test. The error bars in each boxplot show the 95% confidence interval. The line in the box shows the median, and the top and bottom show the 25th and 75th percentiles respectively.
Figure 4
Figure 4
Immune activity related score and immune cell fractionation by the bile acid metabolism score. A. Box-and-whisker plots show SNV neoantigen, Indel neoantigen, interferon gamma (IFNγ) response, TIL infiltration, macrophage, and lymphocyte infiltration scores according to the high and low bile acid scores (upper and lower quartiles) in TCGA. B. Box-and-whisker plots show the cell fractions of CD8+ T-cells, CD4+ T-cells, type 1 helper T-cells (Th1), M1 and M2 macrophage, as well as cytolytic activity (CYT) score, according to the high and low bile acid score (upper and lower quartiles) in the TCGA, METABRIC, and GSE96058 cohorts. All two-group comparisons were performed using the Wilcoxon signed-rank test. The error bars in each boxplot show the 95% confidence interval. The line in the box shows the median, and the top and bottom show the 25th and 75th percentiles respectively.
Figure 5
Figure 5
Difference in the microbiome between high and low bile acid metabolism breast cancer. A. The Bar plots show the percentage breakdown of microbiome composition at the Phylum, Family, and Genus levels in the high and low bile acid metabolism groups (upper and lower quartiles) in TCGA. B. Univariate association between high and low bile acid metabolism. Boxplots in the left panel show the distribution of the microbial abundance of the high (red) and low (blue) groups. The median is represented by a black line in the box, with whiskers extending up to the most extreme points within a 1.5-fold interquartile range, and adj. P < 0.05 was adopted as significant. Generalized fold change is shown in the right panel.
Figure 6
Figure 6
GSEA by bacterial species specific to high and low bile acid metabolism groups. (A) Dot plots show the gene sets significantly enriched by GSEA in groups with high or low abundances (median cutoff) of Gammaretrovirus, Hymenobacter, Anaerococcus, and Collimonas which were specific to the high bile acid metabolism group in TCGA. (B) Dot plots show the gene sets significantly enriched by GSEA in groups with high or low abundances (median cutoff) of Lactobacillus, Ruegeria, and Marichromatium which were specific to the low bile acid metabolism group in TCGA. The horizontal scale and the color of each dot indicate normalized enrichment score (NES) (high values are shown in red and low in blue in A, and vice versa in B), and the size of each dot indicates false discovery rate (FDR). FDR less than 0.25 is considered significant.

Similar articles

Cited by

References

    1. Schramm G, Surmann EM, Wiesberg S, Oswald M, Reinelt G, Eils R, Konig R. Analyzing the regulation of metabolic pathways in human breast cancer. BMC Med Genomics. 2010;3:39. - PMC - PubMed
    1. Dieleman S, Aarnoutse R, Ziemons J, Kooreman L, Boleij A, Smidt M. Exploring the potential of breast microbiota as biomarker for breast cancer and therapeutic response. Am J Pathol. 2021;191:968–982. - PubMed
    1. Miko E, Kovacs T, Sebo E, Toth J, Csonka T, Ujlaki G, Sipos A, Szabo J, Mehes G, Bai P. Microbiome-microbial metabolome-cancer cell interactions in breast cancer-familiar, but unexplored. Cells. 2019;8:293. - PMC - PubMed
    1. Perez MJ, Briz O. Bile-acid-induced cell injury and protection. World J Gastroenterol. 2009;15:1677–1689. - PMC - PubMed
    1. Arnone AA, Cline JM, Soto-Pantoja DR, Cook KL. Investigating the role of endogenous estrogens, hormone replacement therapy, and blockade of estrogen receptor-alpha activity on breast metabolic signaling. Breast Cancer Res Treat. 2021;190:53–67. - PMC - PubMed

LinkOut - more resources