

Development and validation of a nomogram for the early prediction of acute kidney injury in hospitalized COVID-19 patients
- PMID: 36505004
- PMCID: PMC9730715
- DOI: 10.3389/fpubh.2022.1047073
Development and validation of a nomogram for the early prediction of acute kidney injury in hospitalized COVID-19 patients
Abstract
Introduction: Acute kidney injury (AKI) is a prevalent complication of coronavirus disease 2019 (COVID-19) and is closely linked with a poorer prognosis. The aim of this study was to develop and validate an easy-to-use and accurate early prediction model for AKI in hospitalized COVID-19 patients.
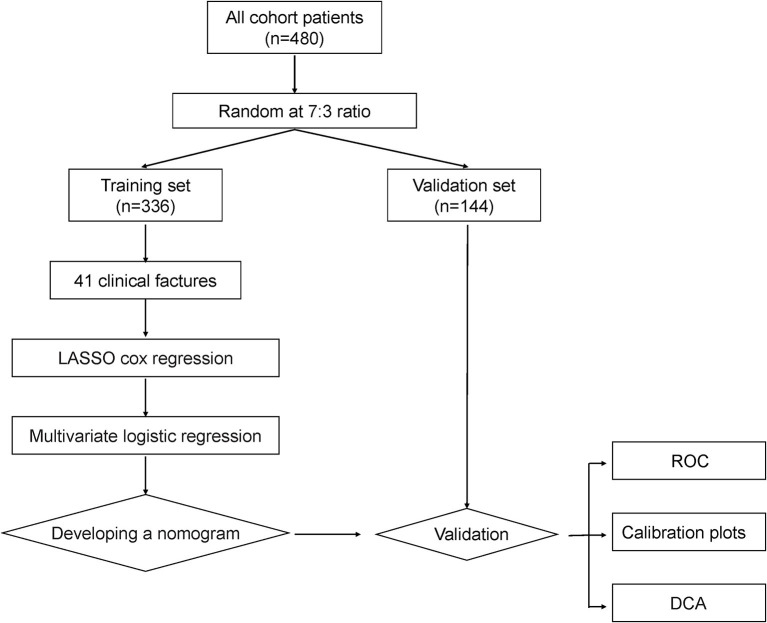
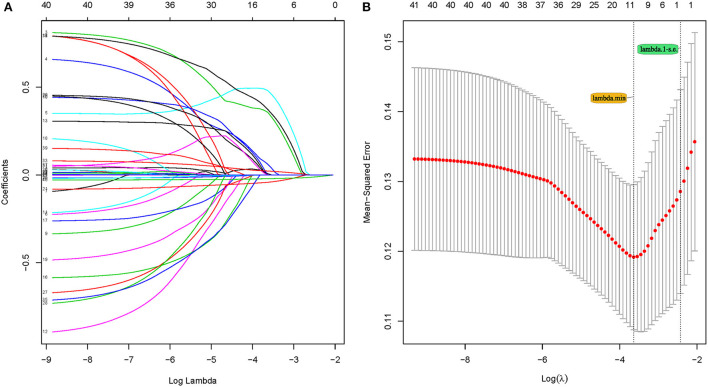
Methods: Data from 480 COVID-19-positive patients (336 in the training set and 144 in the validation set) were obtained from the public database of the Cancer Imaging Archive (TCIA). The least absolute shrinkage and selection operator (LASSO) regression method and multivariate logistic regression were used to screen potential predictive factors to construct the prediction nomogram. Receiver operating curves (ROC), calibration curves, as well as decision curve analysis (DCA) were adopted to assess the effectiveness of the nomogram. The prognostic value of the nomogram was also examined.
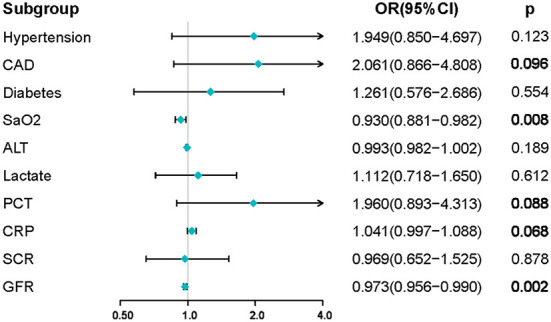
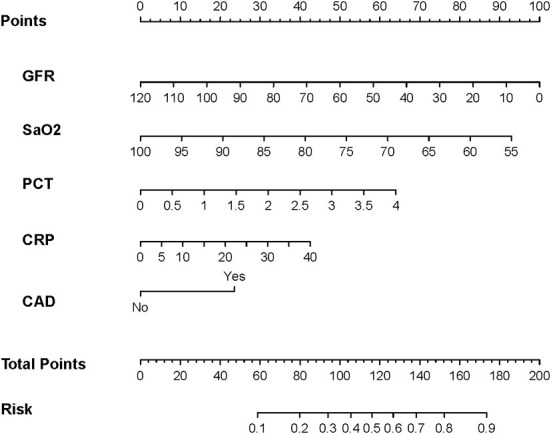
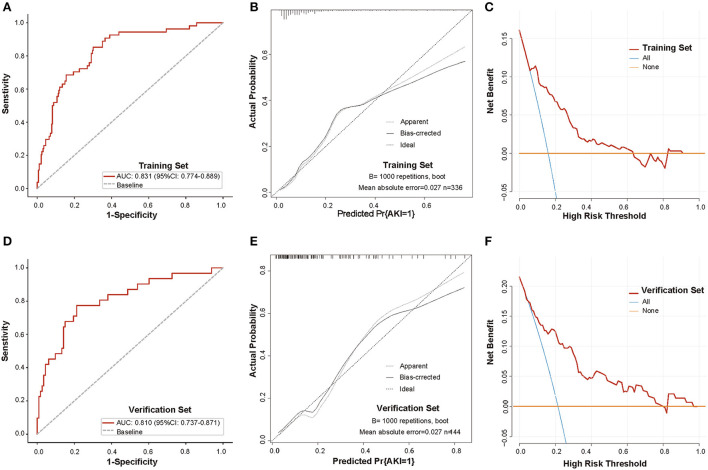
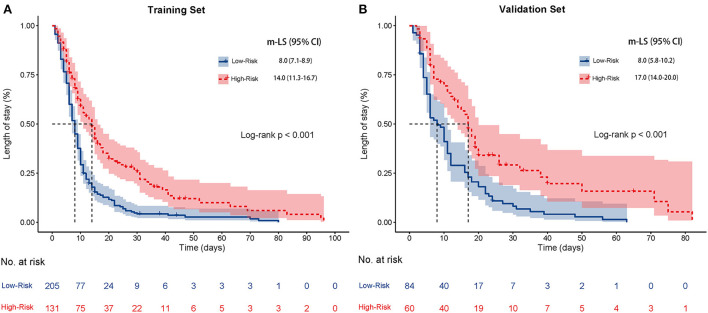
Results: A predictive nomogram for AKI was developed based on arterial oxygen saturation, procalcitonin, C-reactive protein, glomerular filtration rate, and the history of coronary artery disease. In the training set, the nomogram produced an AUC of 0.831 (95% confidence interval [CI]: 0.774-0.889) with a sensitivity of 85.2% and a specificity of 69.9%. In the validation set, the nomogram produced an AUC of 0.810 (95% CI: 0.737-0.871) with a sensitivity of 77.4% and a specificity of 78.8%. The calibration curve shows that the nomogram exhibited excellent calibration and fit in both the training and validation sets. DCA suggested that the nomogram has promising clinical effectiveness. In addition, the median length of stay (m-LS) for patients in the high-risk group for AKI (risk score ≥ 0.122) was 14.0 days (95% CI: 11.3-16.7 days), which was significantly longer than 8.0 days (95% CI: 7.1-8.9 days) for patients in the low-risk group (risk score <0.122) (hazard ratio (HR): 1.98, 95% CI: 1.55-2.53, p < 0.001). Moreover, the mortality rate was also significantly higher in the high-risk group than that in the low-risk group (20.6 vs. 2.9%, odd ratio (OR):8.61, 95%CI: 3.45-21.52).
Conclusions: The newly constructed nomogram model could accurately identify potential COVID-19 patients who may experience AKI during hospitalization at the very beginning of their admission and may be useful for informing clinical prognosis.
Keywords: COVID-19; acute kidney injury; length of stay; mortality; nomogram.
Copyright © 2022 Wang, Sun, Li, Wu, Chen, Zou, Jiang and Lv.
Conflict of interest statement
The authors declare that the research was conducted in the absence of any commercial or financial relationships that could be construed as a potential conflict of interest.
Figures
Similar articles
-
Nomogram to predict the risk of acute kidney injury in patients with diabetic ketoacidosis: an analysis of the MIMIC-III database.BMC Endocr Disord. 2021 Mar 4;21(1):37. doi: 10.1186/s12902-021-00696-8. BMC Endocr Disord. 2021. PMID: 33663489 Free PMC article.
-
[Construction and validation of a risk nomogram for sepsis-associated acute kidney injury in intensive care unit].Zhonghua Wei Zhong Bing Ji Jiu Yi Xue. 2024 Aug;36(8):801-807. doi: 10.3760/cma.j.cn121430-20240221-00150. Zhonghua Wei Zhong Bing Ji Jiu Yi Xue. 2024. PMID: 39238403 Chinese.
-
Construction and evaluation of a mortality prediction model for patients with acute kidney injury undergoing continuous renal replacement therapy based on machine learning algorithms.Ann Med. 2024 Dec;56(1):2388709. doi: 10.1080/07853890.2024.2388709. Epub 2024 Aug 19. Ann Med. 2024. PMID: 39155811 Free PMC article.
-
[Development and validation of a nomogram for predicting 3-month mortality risk in patients with sepsis-associated acute kidney injury].Zhonghua Wei Zhong Bing Ji Jiu Yi Xue. 2024 May;36(5):465-470. doi: 10.3760/cma.j.cn121430-20231218-01091. Zhonghua Wei Zhong Bing Ji Jiu Yi Xue. 2024. PMID: 38845491 Chinese.
-
Prognostic Nutritional Index Combined with Triglyceride-Glucose Index to Contrast a Nomogram for Predicting Contrast-Induced Kidney Injury in Type 2 Diabetes Mellitus Patients with Acute Coronary Syndrome After Percutaneous Coronary Intervention.Clin Interv Aging. 2023 Oct 3;18:1663-1673. doi: 10.2147/CIA.S429957. eCollection 2023. Clin Interv Aging. 2023. PMID: 37810953 Free PMC article.
Cited by
-
Urine Parameters in Patients with COVID-19 Infection.Life (Basel). 2023 Jul 28;13(8):1640. doi: 10.3390/life13081640. Life (Basel). 2023. PMID: 37629497 Free PMC article. Review.
-
Machine learning-based prediction model of acute kidney injury in patients with acute respiratory distress syndrome.BMC Pulm Med. 2023 Oct 3;23(1):370. doi: 10.1186/s12890-023-02663-6. BMC Pulm Med. 2023. PMID: 37789305 Free PMC article.
-
Nomogram-based prediction model for survival of COVID-19 patients: A clinical study.Heliyon. 2023 Sep 14;9(9):e20137. doi: 10.1016/j.heliyon.2023.e20137. eCollection 2023 Sep. Heliyon. 2023. PMID: 37809383 Free PMC article.
References
-
- COVID-19 coronavirus pandemic . Available online at: https://wwwworldometersinfo/coronavirus/ (accessed March 30, 2022).
MeSH terms
Substances
LinkOut - more resources
Full Text Sources
Medical
Research Materials