. 2022 Nov 24:13:977807.
doi: 10.3389/fphys.2022.977807. eCollection 2022.

Adenosine reduces sinoatrial node cell action potential firing rate by uncoupling its membrane and calcium clocks

Affiliations

Adenosine reduces sinoatrial node cell action potential firing rate by uncoupling its membrane and calcium clocks

Ashley N Wirth et al. Front Physiol. .

Abstract

The spontaneous action potential (AP) firing rate of sinoatrial nodal cells (SANC) is regulated by a system of intracellular Ca2+ and membrane ion current clocks driven by Ca2+-calmodulin-activated adenylyl cyclase-protein kinase-A signaling. The mean AP-cycle length (APCL) and APCL variability inform on the effectiveness of clock coupling. Endogenous ATP metabolite adenosine binds to adenosine receptors (A1, A3) that couple to Gi protein-coupled receptors, reducing spontaneous AP firing rate via Gβγ signaling that activates IKAch,Ado. Adenosine also inhibits adenylyl cyclase activity via Gαi signaling, impacting cAMP-mediated protein kinase-A-dependent protein phosphorylation. We hypothesize that in addition to IKAch,Ado activation, adenosine impacts also Ca2+ via Gαi signaling and that both effects reduce AP firing rate by reducing the effectiveness of the Ca2+ and membrane clock coupling. To this end, we measured Ca2+ and membrane potential characteristics in enzymatically isolated single rabbit SANC. 10 µM adenosine substantially increased both the mean APCL (on average by 43%, n = 10) and AP beat-to-beat variability from 5.1 ± 1.7% to 7.2 ± 2.0% (n = 10) measured via membrane potential and 5.0 ± 2.2% to 10.6 ± 5.9% (n = 40) measured via Ca2+ (assessed as the coefficient of variability = SD/mean). These effects were mediated by hyperpolarization of the maximum diastolic membrane potential (membrane clock effect) and suppression of diastolic local Ca2+releases (LCRs) (Ca2+-clock effect): as LCR size distributions shifted to smaller values, the time of LCR occurrence during diastolic depolarization (LCR period) became prolonged, and the ensemble LCR signal became reduced. The tight linear relationship of coupling between LCR period to the APCL in the presence of adenosine "drifted" upward and leftward, i.e. for a given LCR period, APCL was prolonged, becoming non-linear indicating clock uncoupling. An extreme case of uncoupling occurred at higher adenosine concentrations (>100 µM): small stochastic LCRs failed to self-organize and synchronize to the membrane clock, thus creating a failed attempt to generate an AP resulting in arrhythmia and cessation of AP firing. Thus, the effects of adenosine to activate Gβγ and IKACh,Ado and to activate Gαi, suppressing adenylyl cyclase activity, both contribute to the adenosine-induced increase in the mean APCL and APCL variability by reducing the fidelity of clock coupling and AP firing rate.

Keywords: adenosine; calcium release; cardiac arrhythmia; coupled-clock pacemaker system; sarcoplasmic reticulum (SR); sick sinus syndrome; sinoatrial node (SAN); sinus node arrest.


Conflict of interest statement

The authors declare that the research was conducted in the absence of any commercial or financial relationships that could be construed as a potential conflict of interest.

Figures

FIGURE 1
FIGURE 1
(A) Action potentials and AP-Induced Ca2+ transients are highly correlated in SANC in which both Ca2+ and Vm were simultaneously measured (17 cycles measured simultaneously). (B), example of a simultaneous Vm and Ca2+ recording. (C,D) Illustrate Vm and Ca2+ parameters measured in this study.
FIGURE 2
FIGURE 2
Adenosine slows the firing rate of rhythmically firing SANC in a dose-response manner. The IC50 for our dose response curve was 31 µM adenosine. (n = 4 for 100 nm and 1 µM adenosine, n = 5 for 10 µM adenosine, and n = 7 for 100 µM adenosine). The data of firing rate response were normalized to be between 0% and 100% of baseline and fitted to Variable slope model using GraphPad program https://www.graphpad.com/guides/prism/latest/curve-fitting/reg_dr_inhibit_normalized_variable.htm. The equation for this fitting function was: Y = 100/(1 + 10^((LogIC50-X)*HillSlope)].
FIGURE 3
FIGURE 3
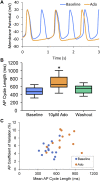
(A) an example of a cell that increased APCL from 577 ms at baseline to 1009 ms with adenosine and recovered to 597 ms with washout (washout not shown). (B) Statistical analysis of adenosine effect: SANC action potential cycle length (APCL) increased with adenosine and recovered with washout in SANC (n = 14). (C) APCL and coefficient of variation (CV) increased with adenosine. *p < 0.05 via one-way repeated measures ANOVA.
FIGURE 4
FIGURE 4
Time controls of Ca2+ and electrophysiology measurements show that SANC action potential cycle length (APCL) and coefficient of variation (CV) do not change with time. Repeated measures ANOVAs of Ca2+ and Vm measurements showed there was no significant time effect on SANC firing rate and CV within twenty minutes. Based on this data, all experiments were performed within twenty minutes.
FIGURE 5
FIGURE 5
(A) an example of a cell that increased APCL from 480 ms at baseline to 888 ms with adenosine and recovered to 648 ms with adenosine and recovered to 648 ms with washout (washout not shown). (B) SANC AP-induced Ca2+ transient cycle length increased with adenosine and recovered partially with washout. (n = 46). (C) SANC AP-Induced Ca2+ transient cycle length and coefficient of variation (CV) increased with adenosine; *p < 0.05 via one-way repeated measures ANOVA.
FIGURE 6
FIGURE 6
Histograms of LCR size (A), LCR duration (B), and mean LCR period (C) percentage distributions in all rhythmic SANC before and in the presence of adenosine (n = 34). Mean LCR period was the averaged LCR period of 3–7 cycles at baseline and with adenosine for each SANC. Mean LCR period also increased in response to adenosine; *p < 0.05 via one-way repeated measures ANOVA.
FIGURE 7
FIGURE 7
(A) an example of a rhythmically firing SANC that decreases in rate of LCR ensemble growth in response to adenosine. There is an overall decrease in global cytosolic Ca2+ with adenosine compared to baseline. Panel (B) depicts the average LCR ensemble growth rate of 5 cycles at baseline and with ado. The average LCR ensemble growth rate decreased to 42% of baseline with adenosine. This decrease reflects the changes in intracellular Ca2+ availability, manifesting in changes to LCR parameters. This results in an extended time period of Ca2+ cycling between AP-induced Ca2+ transients. Panel (C), the correlation between mean LCR Period (3–7 beats) and AP-induced Ca2+ transient cycle length is reduced at longer cycle lengths. At baseline, there is a strong correlation between APCL and LCR period, indicating robust clock coupling (n = 35). Adenosine, in the same population of cells, the mean APCL and LCR period increased for many cells. For a subset of cells, mean APCL increased more than mean LCR period, indicating reduced fidelity of clock coupling indicated by the orange circles that digress up and leftward from the linear trendline (dashed line). The linear trendline includes baseline and ado values. Panel (D), an example of a SANC with ado where LCR ensemble growth propagation was insufficient and failed to generate an AP, resulting in clock uncoupling and a “failed AP attempt”.
FIGURE 8
FIGURE 8
(A) simultaneous Vm and Ca2+ recordings of a rhythmically firing SANC at baseline that fires with decreased rhythmicity in response to 10 µM Ado. (B) the rate of LCR ensemble growth is steeper at baseline (blue line) and decreases in response to adenosine (magenta line). The asterisk indicates the baseline and ado cycle lengths measured in Figure 8A.
FIGURE 9
FIGURE 9
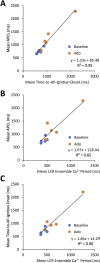
Relationships between key parameters of the coupled-clock system in control (baseline) and in the presence of adenosine in SANC in which Ca2+ and Vm were measured simultaneously. The LCR period informs on the APCL because the LCR period informs on the time-to-AP-ignition onset. Both Time-to-AP-ignition onset (A) and LCR period (B,C) and increase with adenosine.
FIGURE 10
FIGURE 10
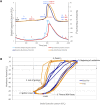
(A) Phase Vm-Ca2+ relationship. (A) one AP cycle (* in Figure 5) prior to (baseline) and during adenosine (Ado) superfusion in which Vm and Ca2+ were measured simultaneously. (B) phase Vm-Ca2+ diagram depicting the relationship between Vm and global cytosolic Ca2+ during several AP cycles (electrochemical gradient oscillations) at baseline (blue) and with adenosine (orange); 4 consecutive cycles from Figure 5 are shown. Numbers 1–5 indicate the times during the AP cycles in Panel (A).
FIGURE 11
FIGURE 11
(A) Simplified schematic of the coupled system of membrane ion current oscillators and Ca2+ oscillators (Coupled-clock system) operative within sinoatrial nodal cells (SANC). The system provides robust and flexible AP firing rates. Constitutively active Ca2+-AC-cAMP-PKA signaling intrinsic to SANC, that is activated by Ca2+ oscillations, couples to an ensemble of electrogenic surface membrane molecules (current oscillators). AC, adenylyl cyclase; cAMP, cyclic AMP; PKA, protein kinase A; A1R, adenosine A1 receptor; Gαi, Gi protein alpha subunit; Gβγ, Gi protein beta gamma subunit; RyR, ryanodine receptor; SERCA, sarco-endoplasmic reticulum Ca2+-ATPase; PLB, phospholamban; SR, Sarcoplasmic reticulum; CaMKII, Ca2+/calmodulin-dependent protein kinase II; IK, delayed rectifier K+ current; IKACh,Ado, Acetylcholine/Adenosine-activated K+ current; If, HCN currents; ICaL, L-type Ca2+ current; INCX, Na+/Ca2+ exchanger currents; and INaKATPase, Na+/K+ pump. (B) A schematic for SANC clock coupling/uncoupling. Clocks are coupled in the awake basal state, in response to physiologic stress (beta-adrenergic stimulation) coupling increases and beat-to-beat variability is reduced. In physiologic responses to vagal stimulation or adenosine, the clocks become partially uncoupled and the APCL becomes prolonged. These effects become more exaggerated as Gi coupled stimulation increases at higher drug concentrations.
FIGURE 12
FIGURE 12
Synergism of different component mechanisms in SANC rate slowing by ACh. Results of numerical model predictions for spontaneous AP rate reduction at various moderate ACh concentrations (up to 100 nM) for different mechanisms (labels). Since ACh and ado act via the same signaling mechanism, a similar result is expected for ado. Modified from (Maltsev and Lakatta, 2010).

Similar articles

Cited by

References

    1. Axsom J. E., Nanavati A. P., Rutishauser C. A., Bonin J. E., Moen J. M., Lakatta E. G. (2020). Acclimation to a thermoneutral environment abolishes age-associated alterations in heart rate and heart rate variability in conscious, unrestrained mice. Geroscience 42, 217–232. 10.1007/s11357-019-00126-7 - DOI - PMC - PubMed
    1. Belardinelli L., Giles W. R., West A. (1988). Ionic mechanisms of adenosine actions in pacemaker cells from rabbit heart. J. Physiol. 405, 615–633. 10.1113/jphysiol.1988.sp017352 - DOI - PMC - PubMed
    1. Belardinelli L., Shryock J. C., Song Y., Wang D., Srinivas M. (1995). Ionic basis of the electrophysiological actions of adenosine on cardiomyocytes. FASEB J. 9, 359–365. 10.1096/fasebj.9.5.7896004 - DOI - PubMed
    1. Bogdanov K. Y., Vinogradova T. M., Lakatta E. G. (2001). Sinoatrial nodal cell ryanodine receptor and Na+-Ca2+ exchanger: Molecular partners in pacemaker regulation. Circ. Res. 88, 1254–1258. 10.1161/hh1201.092095 - DOI - PubMed
    1. Boyett M. R., Honjo H., Kodama I. (2000). The sinoatrial node, a heterogeneous pacemaker structure. Cardiovasc. Res. 47, 658–687. 10.1016/s0008-6363(00)00135-8 - DOI - PubMed