

Dysfunctional intercellular communication and metabolic signaling pathways in thin endometrium
- PMID: 36505055
- PMCID: PMC9729336
- DOI: 10.3389/fphys.2022.1050690
Dysfunctional intercellular communication and metabolic signaling pathways in thin endometrium
Abstract
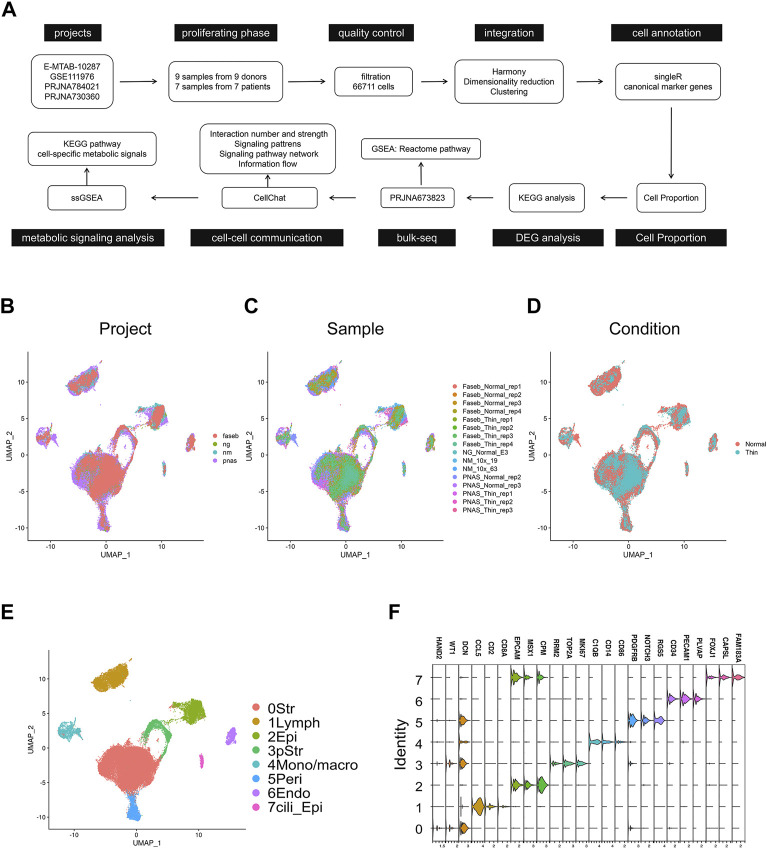
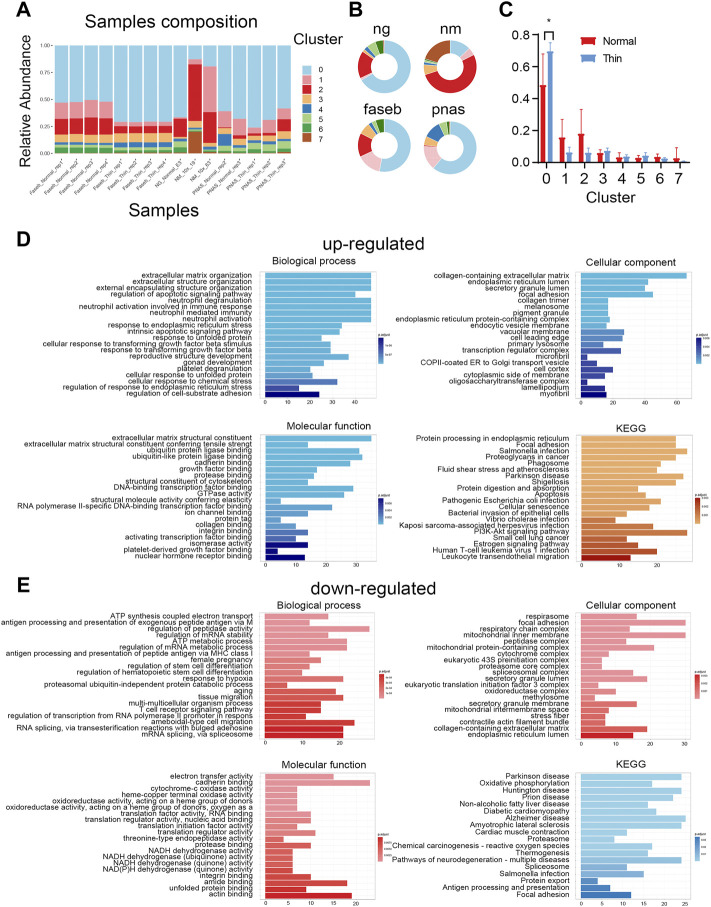
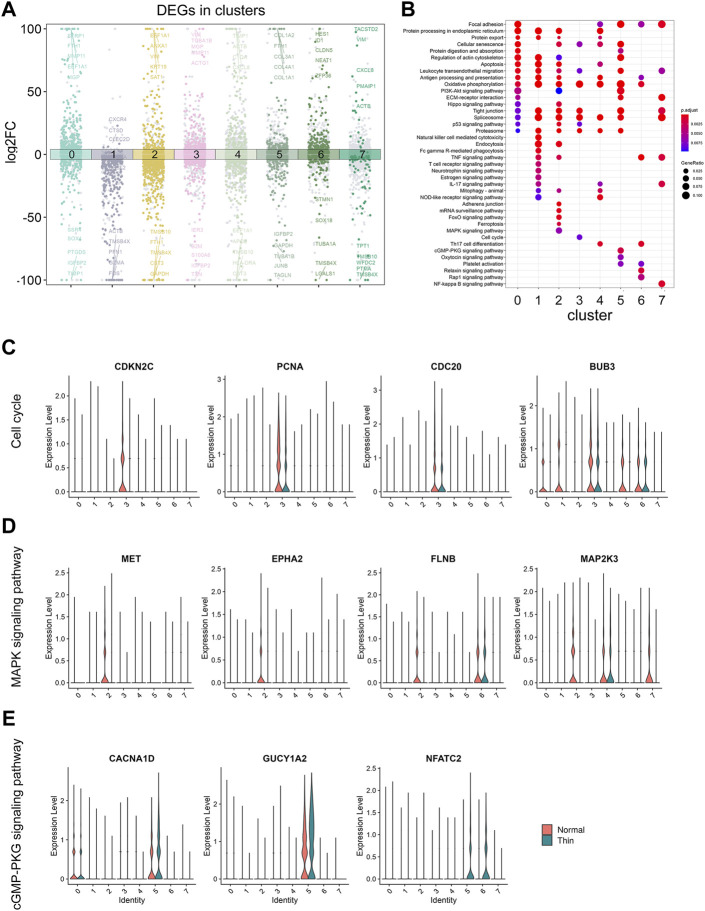
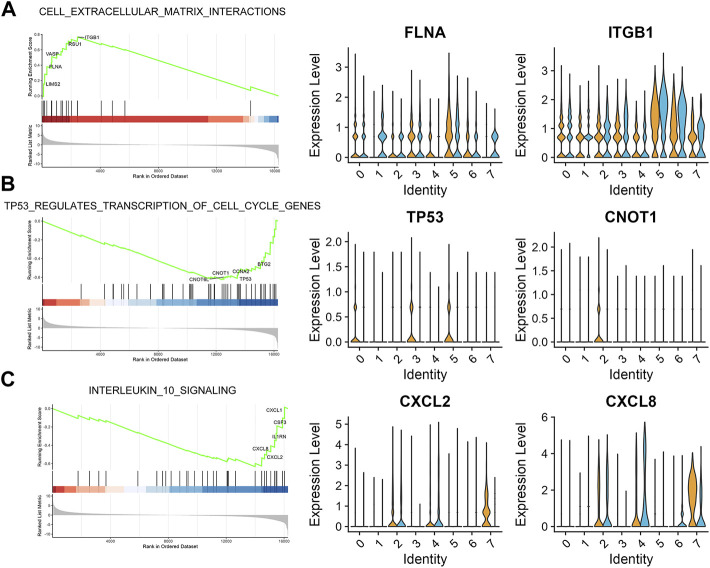
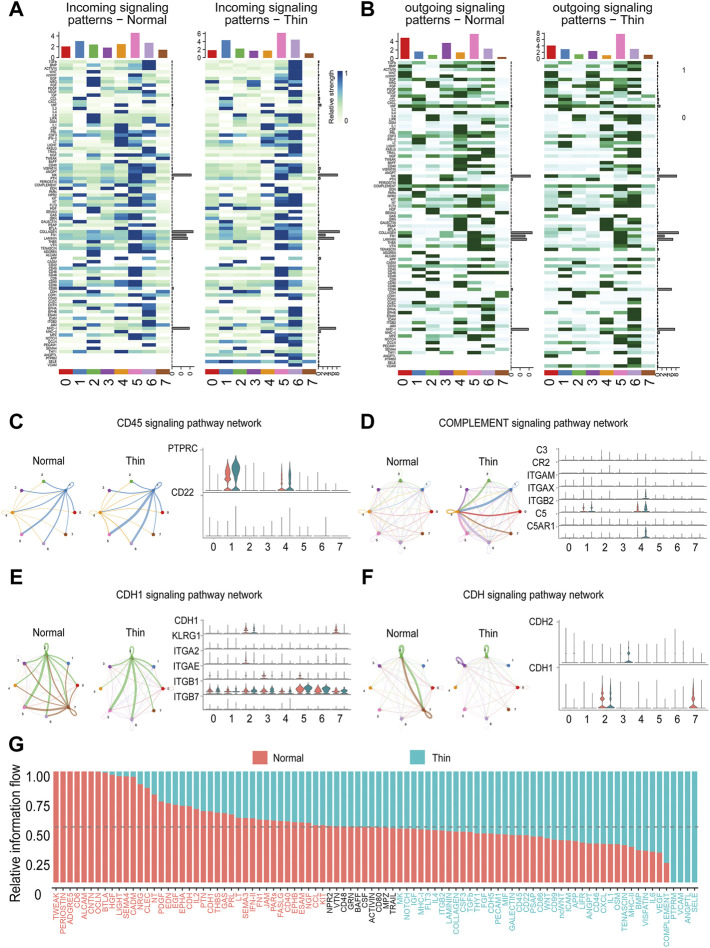
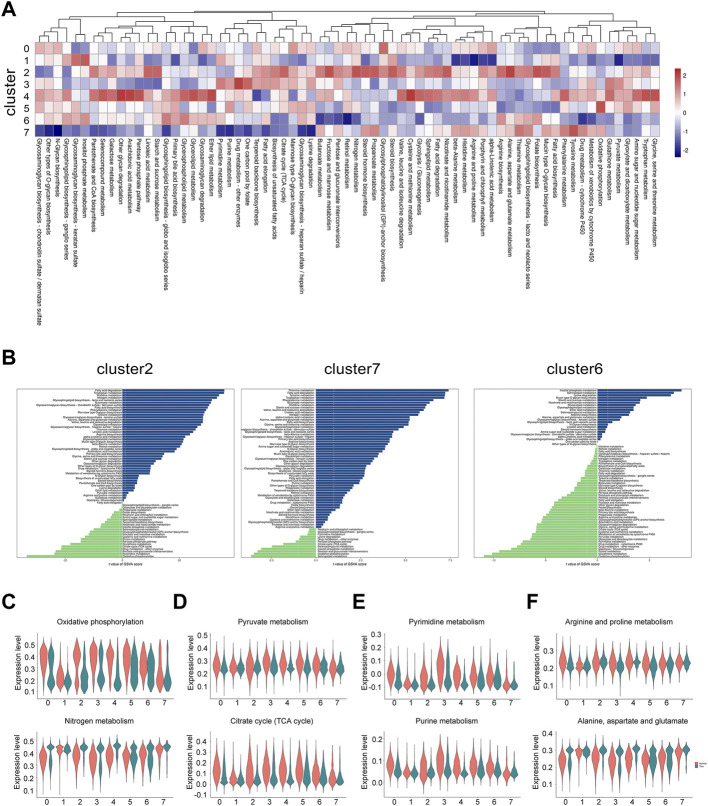
Background: The endometrial thickness is a key factor for successful implantation. Thin endometrium is associated with lower implantation rate and pregnancy rate. Lacking of a better understanding for the cellular and molecular mechanisms of thin endometrium, managing patients with thin endometrium still represents a major challenge for clinicians. Methods: In this study, we combined four single-cell RNA sequencing (scRNA-seq) and one bulk sequencing (bulk-seq) data for thin endometrium to perform an integrated analysis for endometrial cells in proliferating phase. Cell proportion and differentially expressed genes (DEGs) were analyzed to determine the disease-specific cell type and signaling pathways. The cell-cell communication among cell types were inferred by "CellChat" to illustrate the differential intercellular communication under normal and thin endometrium conditions. GSEA and GSVA were applied to identify dysfunctional signals and metabolic pathways before and after thin endometrium. Results: Integration of scRNA-seq identified eight cell types. The proportion of stromal cells showed a significant difference between normal and thin endometrial tissue. The DEGs in diverse cell types revealed enriched pathways in a cell-specific manner. Aberrant cell-cell signaling transduction was found in almost all cell types, especially in immune cells and epithelial cells. Furthermore, dysfunctional metabolic signaling pathways were induced in a cell-type dependent way. The down-regulation of carbohydrate metabolism and nucleotide metabolism was observed and the energy metabolism switch was indicated. Conclusion: Conclusively, we discover dysfunctional signals and metabolic pathways in thin endometrium, providing insight into mechanisms and therapeutic strategies for the atrophic endometrium.
Keywords: cell diversity; cell-cell communication; metabolic signaling; single-cell sequencing; thin endometrium.
Copyright © 2022 Xu, Fan, Wang and Shi.
Conflict of interest statement
The authors declare that the research was conducted in the absence of any commercial or financial relationships that could be construed as a potential conflict of interest.
Figures
Similar articles
-
Dysfunction of Endothelial Cell-Mediated Intercellular Communication and Metabolic Pathways in Age-Related Macular Degeneration.Curr Eye Res. 2025 Feb;50(2):169-181. doi: 10.1080/02713683.2024.2407361. Epub 2024 Sep 27. Curr Eye Res. 2025. PMID: 39329213
-
Deciphering the endometrial niche of human thin endometrium at single-cell resolution.Proc Natl Acad Sci U S A. 2022 Feb 22;119(8):e2115912119. doi: 10.1073/pnas.2115912119. Proc Natl Acad Sci U S A. 2022. PMID: 35169075 Free PMC article.
-
Integrated Transcriptomic Analysis of the miRNA-mRNA Interaction Network in Thin Endometrium.Front Genet. 2021 Mar 16;12:589408. doi: 10.3389/fgene.2021.589408. eCollection 2021. Front Genet. 2021. PMID: 33796129 Free PMC article.
-
Adenomyosis pathogenesis: insights from next-generation sequencing.Hum Reprod Update. 2021 Oct 18;27(6):1086-1097. doi: 10.1093/humupd/dmab017. Hum Reprod Update. 2021. PMID: 34131719 Free PMC article. Review.
-
FoxO1 is a cell-specific core transcription factor for endometrial remodeling and homeostasis during menstrual cycle and early pregnancy.Hum Reprod Update. 2021 Apr 21;27(3):570-583. doi: 10.1093/humupd/dmaa060. Hum Reprod Update. 2021. PMID: 33434267 Review.
Cited by
-
Crosstalk among podocytes, glomerular endothelial cells and mesangial cells in diabetic kidney disease: an updated review.Cell Commun Signal. 2024 Feb 19;22(1):136. doi: 10.1186/s12964-024-01502-3. Cell Commun Signal. 2024. PMID: 38374141 Free PMC article. Review.
-
Comprehensive single-cell transcriptome analysis of autologous platelet-rich plasma therapy on human thin endometrium.Sci Rep. 2025 Apr 26;15(1):14637. doi: 10.1038/s41598-025-99468-w. Sci Rep. 2025. PMID: 40287476 Free PMC article.
-
Bioengineering approaches for the endometrial research and application.Mater Today Bio. 2024 Apr 3;26:101045. doi: 10.1016/j.mtbio.2024.101045. eCollection 2024 Jun. Mater Today Bio. 2024. PMID: 38600921 Free PMC article. Review.
-
Advances in the Pathophysiology of Thin Endometrium.Reprod Sci. 2025 May 30. doi: 10.1007/s43032-025-01882-y. Online ahead of print. Reprod Sci. 2025. PMID: 40447929 Review.
-
Altered Expressions of IL-15, IFNG, and HPRT1 Genes in the Thin Endometria of Patients with Reproductive Disorders: A Prospective Comparative Study.J Clin Med. 2024 Oct 17;13(20):6184. doi: 10.3390/jcm13206184. J Clin Med. 2024. PMID: 39458137 Free PMC article.
References
LinkOut - more resources
Full Text Sources